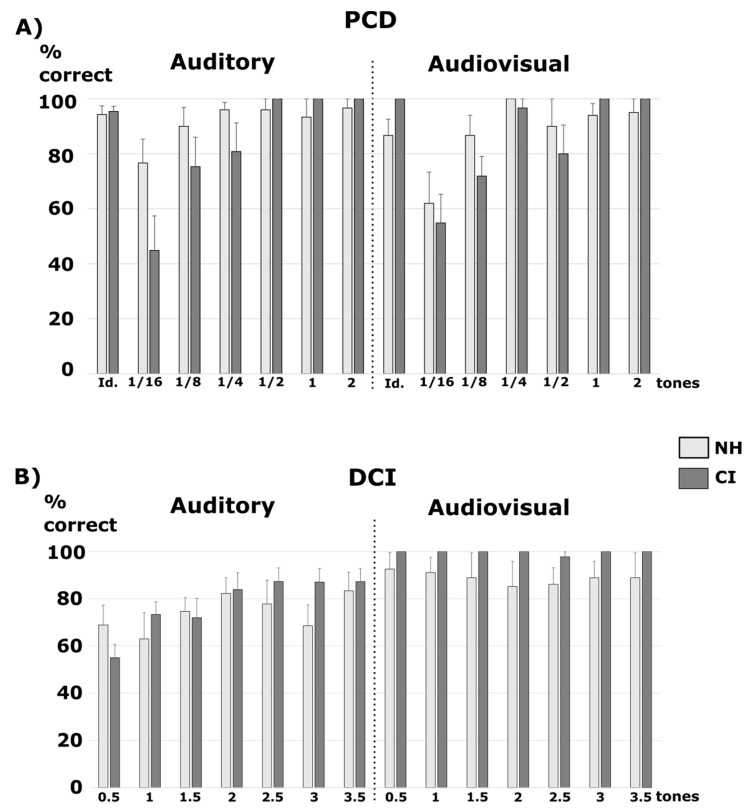
Figure 5.
Results of the NH participants and CI users in the PCD and DCI, according to the size of the changes. The percentages of correct responses for auditory and audiovisual trials are reported for PCD (A) and DCI (B). For PCD, six size changes were present for the different trials: 1/16, 1/8, ¼, ½, 1, or 2 tones, and the results for identical trials are also presented. For DCI, seven size changes were presented: 0.5, 1, 1.5, 2; 2.5, 3, or 3.5 tones. The error bars represent the standard error of the mean. PCD: Pitch change Detection; DCI: Direction Change Identification; Id.: Identical trials.

