Figure 6.
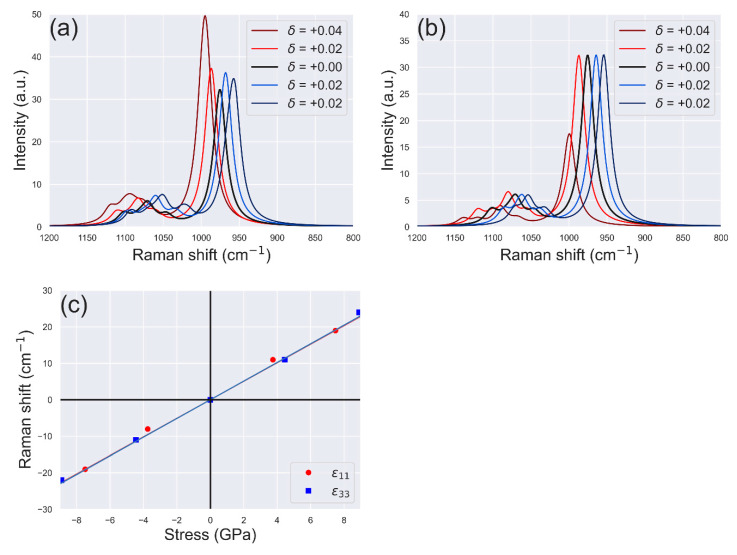
Simulated Raman spectra of hydroxylapatite, between 800 cm−1 and 1200 cm−1 (ν1 phosphate band), under the effect of uniaxial deformation (a) ε11 and (b) ε33, with δ representing the extent of deformation (adimensional number). (c) Dependence of the position (Raman shift) of the ν1 phosphate band on the applied uniaxial stress.

