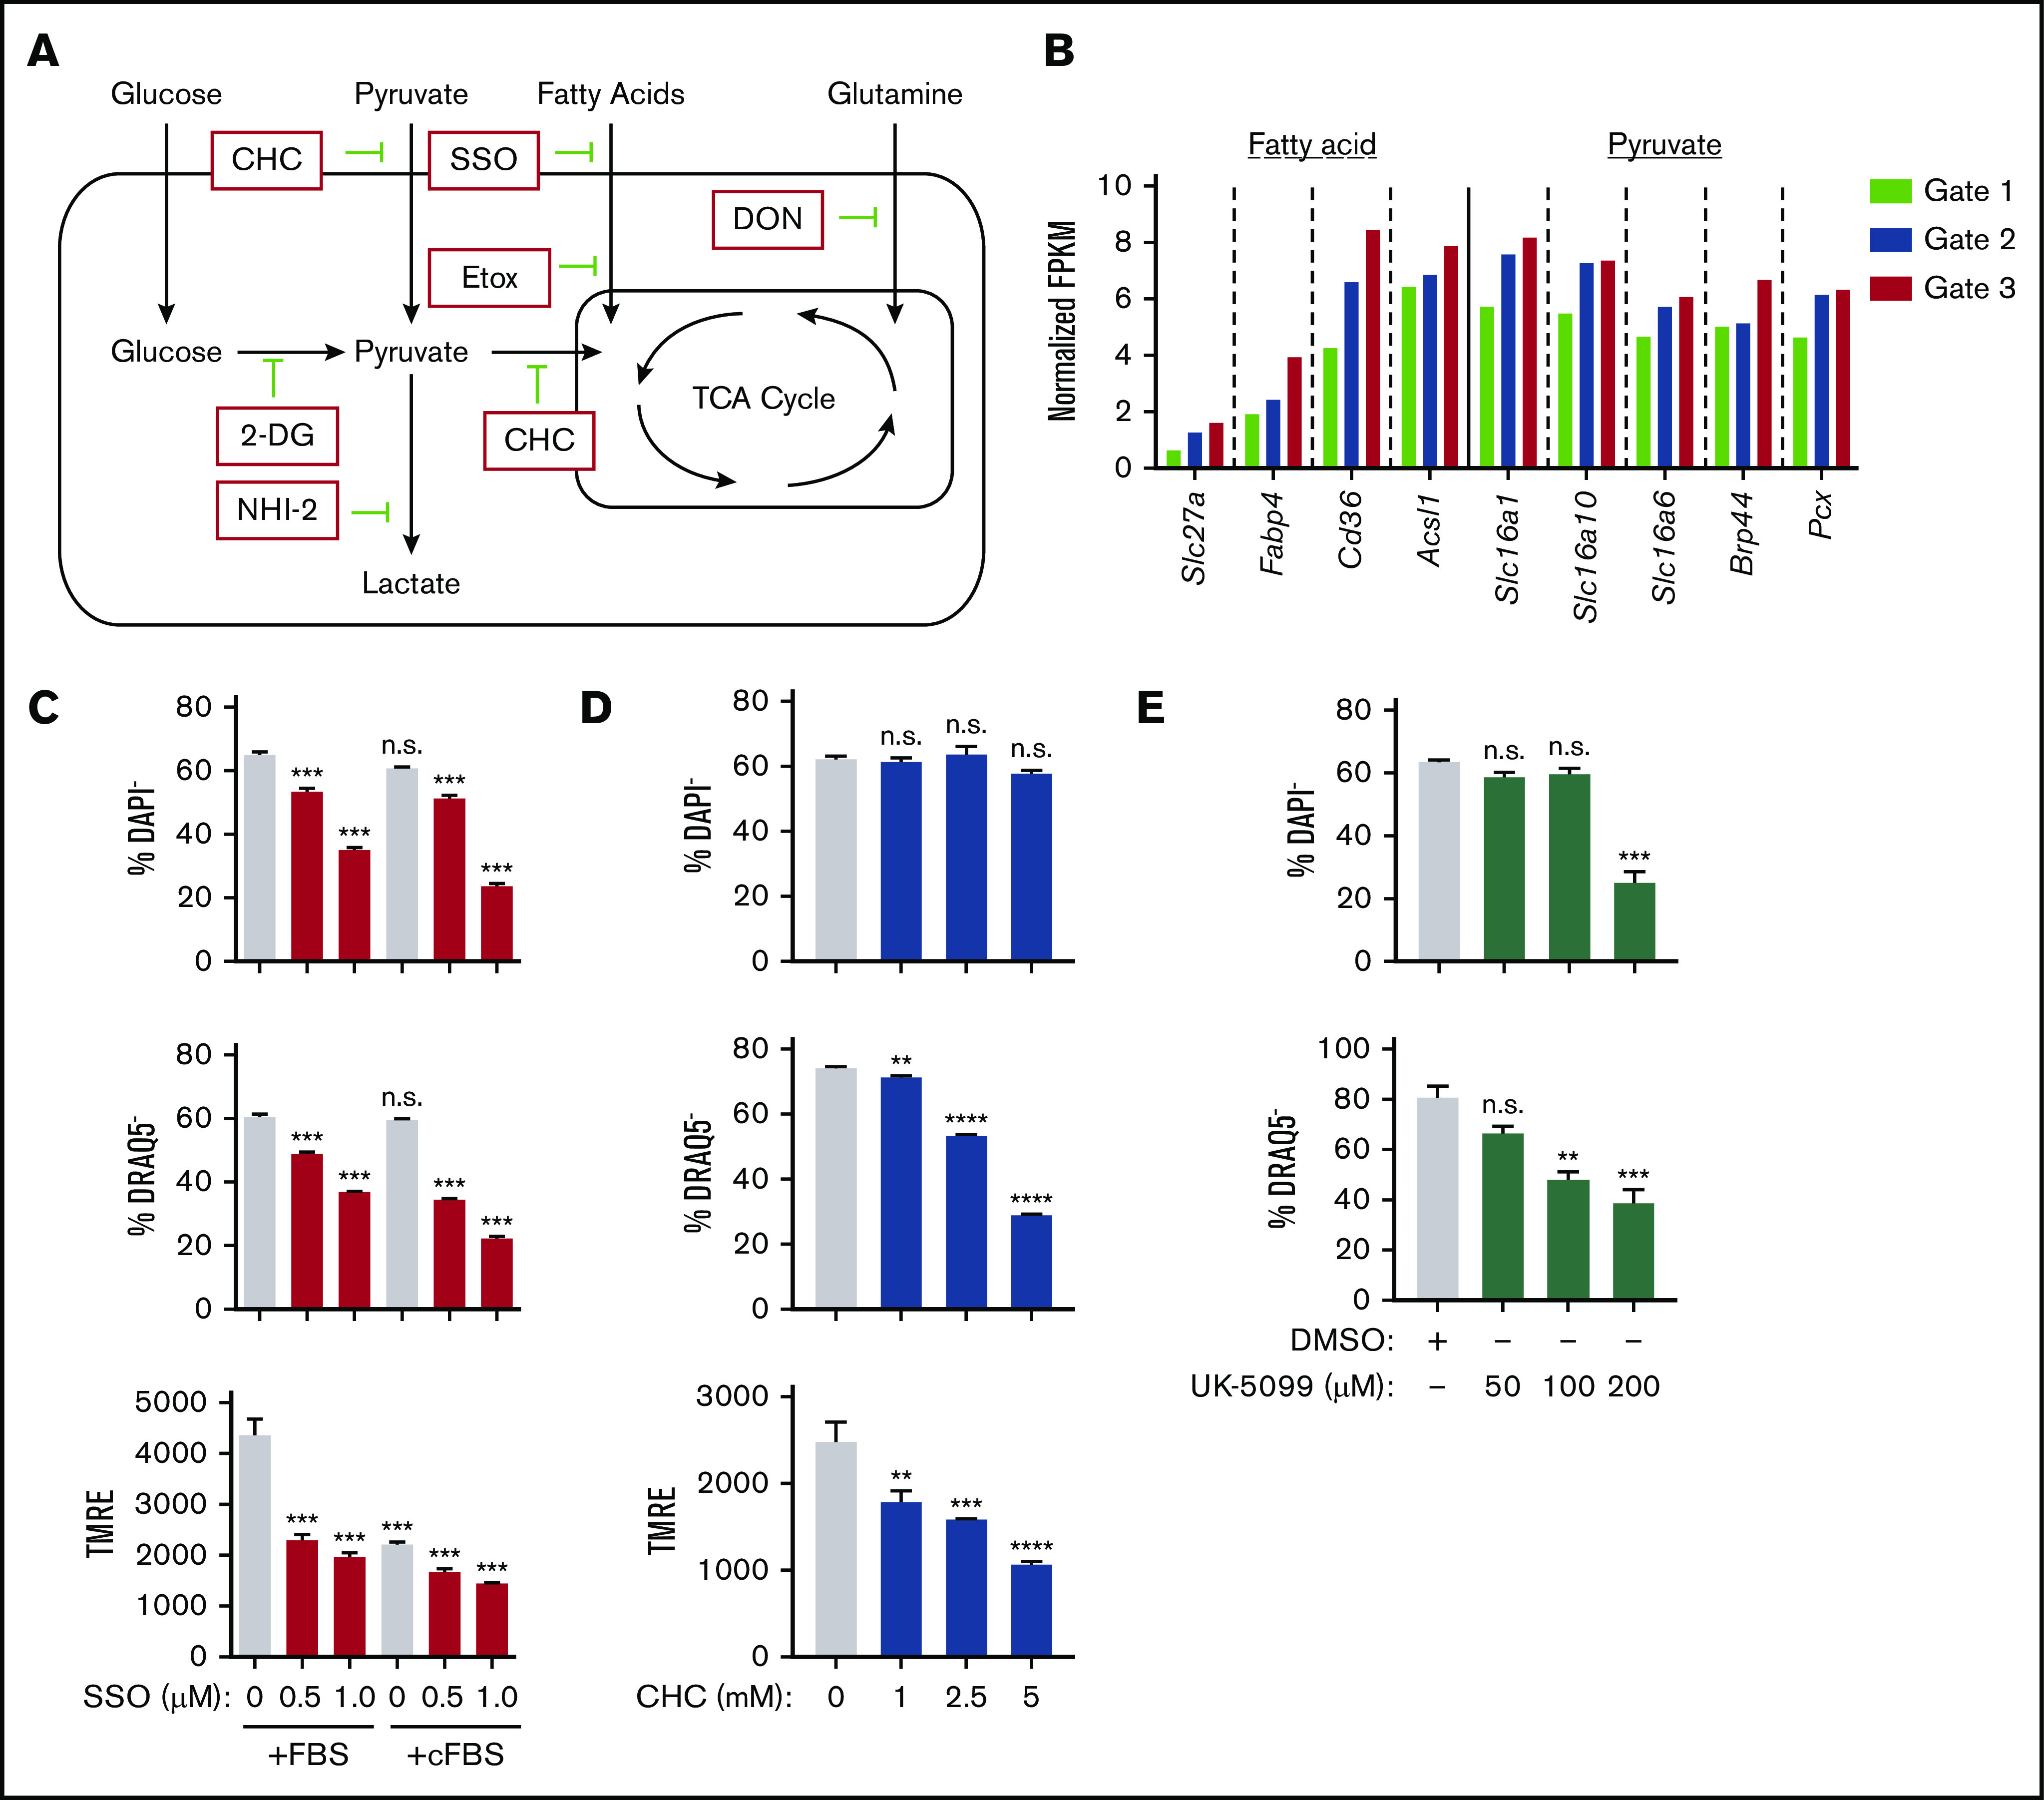
Figure 6.

Identification of the main metabolic pathway fueling mitochondria during murine erythroblast enucleation. (A) Diagram depicting main cellular metabolic pathways, the substrates feeding into mitochondria and TCA cycle and their inhibitors. (B) Cluster of genes that are upregulated as erythroblasts mature identified through published RNA sequencing data.10 Normalized fragments per kilobase million (FPKM) values for various genes from cluster, which were identified to be important for use of fatty acids, pyruvate, and other monocarboxylates. (C-E) Ex vivo enucleation assay testing the effect of indicated inhibitors of fatty acid (sulfo-N-succinimidyl oleate [SSO]) (C) or pyruvate (D-E) metabolism. Plots display quantification of viability (top), enucleation (middle), and mitochondrial activity (bottom). Plots display quantification of viability and enucleation. Mean ± standard error of the mean (n ≥ 3). **P < .01, ***P < .001, ****P < .0001. cFBS, charcoal-stripped FBS; CHC, α-cyano-4-hydroxycinnamic acid; DMSO, dimethyl sulfoxide; DON, 6-diazo-5-oxo-L-norleucine.
