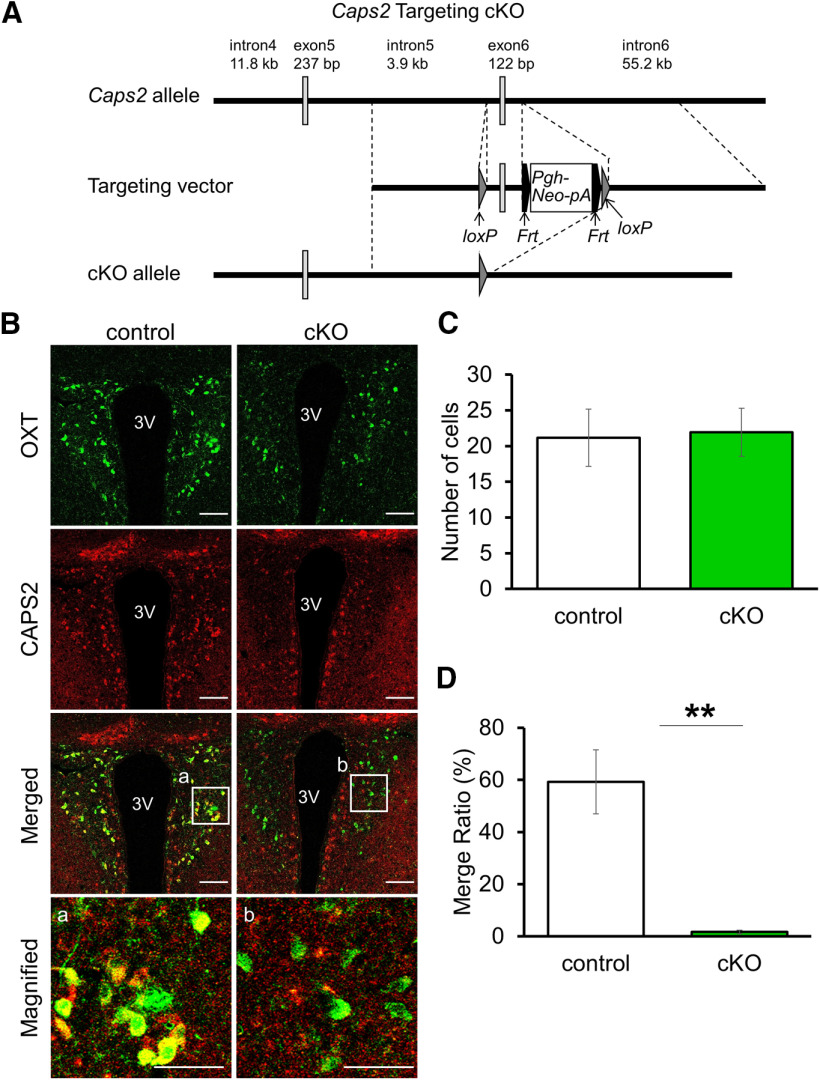
Figure 6.
Conditional Caps2 KO in OXT neurons. A, Construction of Caps2 cKO mice. The genomic structure of the mouse Caps2 allele (top line), the basic structure of the targeting vector (middle line), and the genome structure of the Caps2 cKO allele (bottom line). The Caps2 cKO line was generated by crossing Oxt-iCre KI mice (OxtCre/+) with Caps2 flox mice (Caps2fl/fl) (see Materials and Methods). B, Representative images of coronal PVN sections immunostained for OXT (green) and CAPS2 (red) in control (Oxt+/+, Caps2fl/fl) (left) and Caps2 cKO (OxtCre/+, Caps2fl/fl) (right) mice on the top and second rows, respectively. The merged images and their magnified views inside boxed areas a and b are shown on the third and bottom rows, respectively. Scale bars: 100 µm, magnified views 50 µm. 3V, third ventricle. C, Number of OXT-positive cells in the PVN. Control (N = 3 mice): 21.18 ± 4.01, Caps2 cKO (N = 3 mice): 21.92 ± 3.36. A total of 8–22 sections were used for each analysis. Student's t test, p = 0.89. Data represent the mean ± SEM. D, Ratio of OXT- and CAPS2-double-positive cells in the PVN. Control (N = 3 mice): 59.23 ± 12.27, Caps2 cKO (N = 3 mice): 1.64 ± 0.67. A total of 8–22 sections were used for each analysis. Student's t test, p = 0.0094. **p < 0.01. Data represent the means ± SEM.

