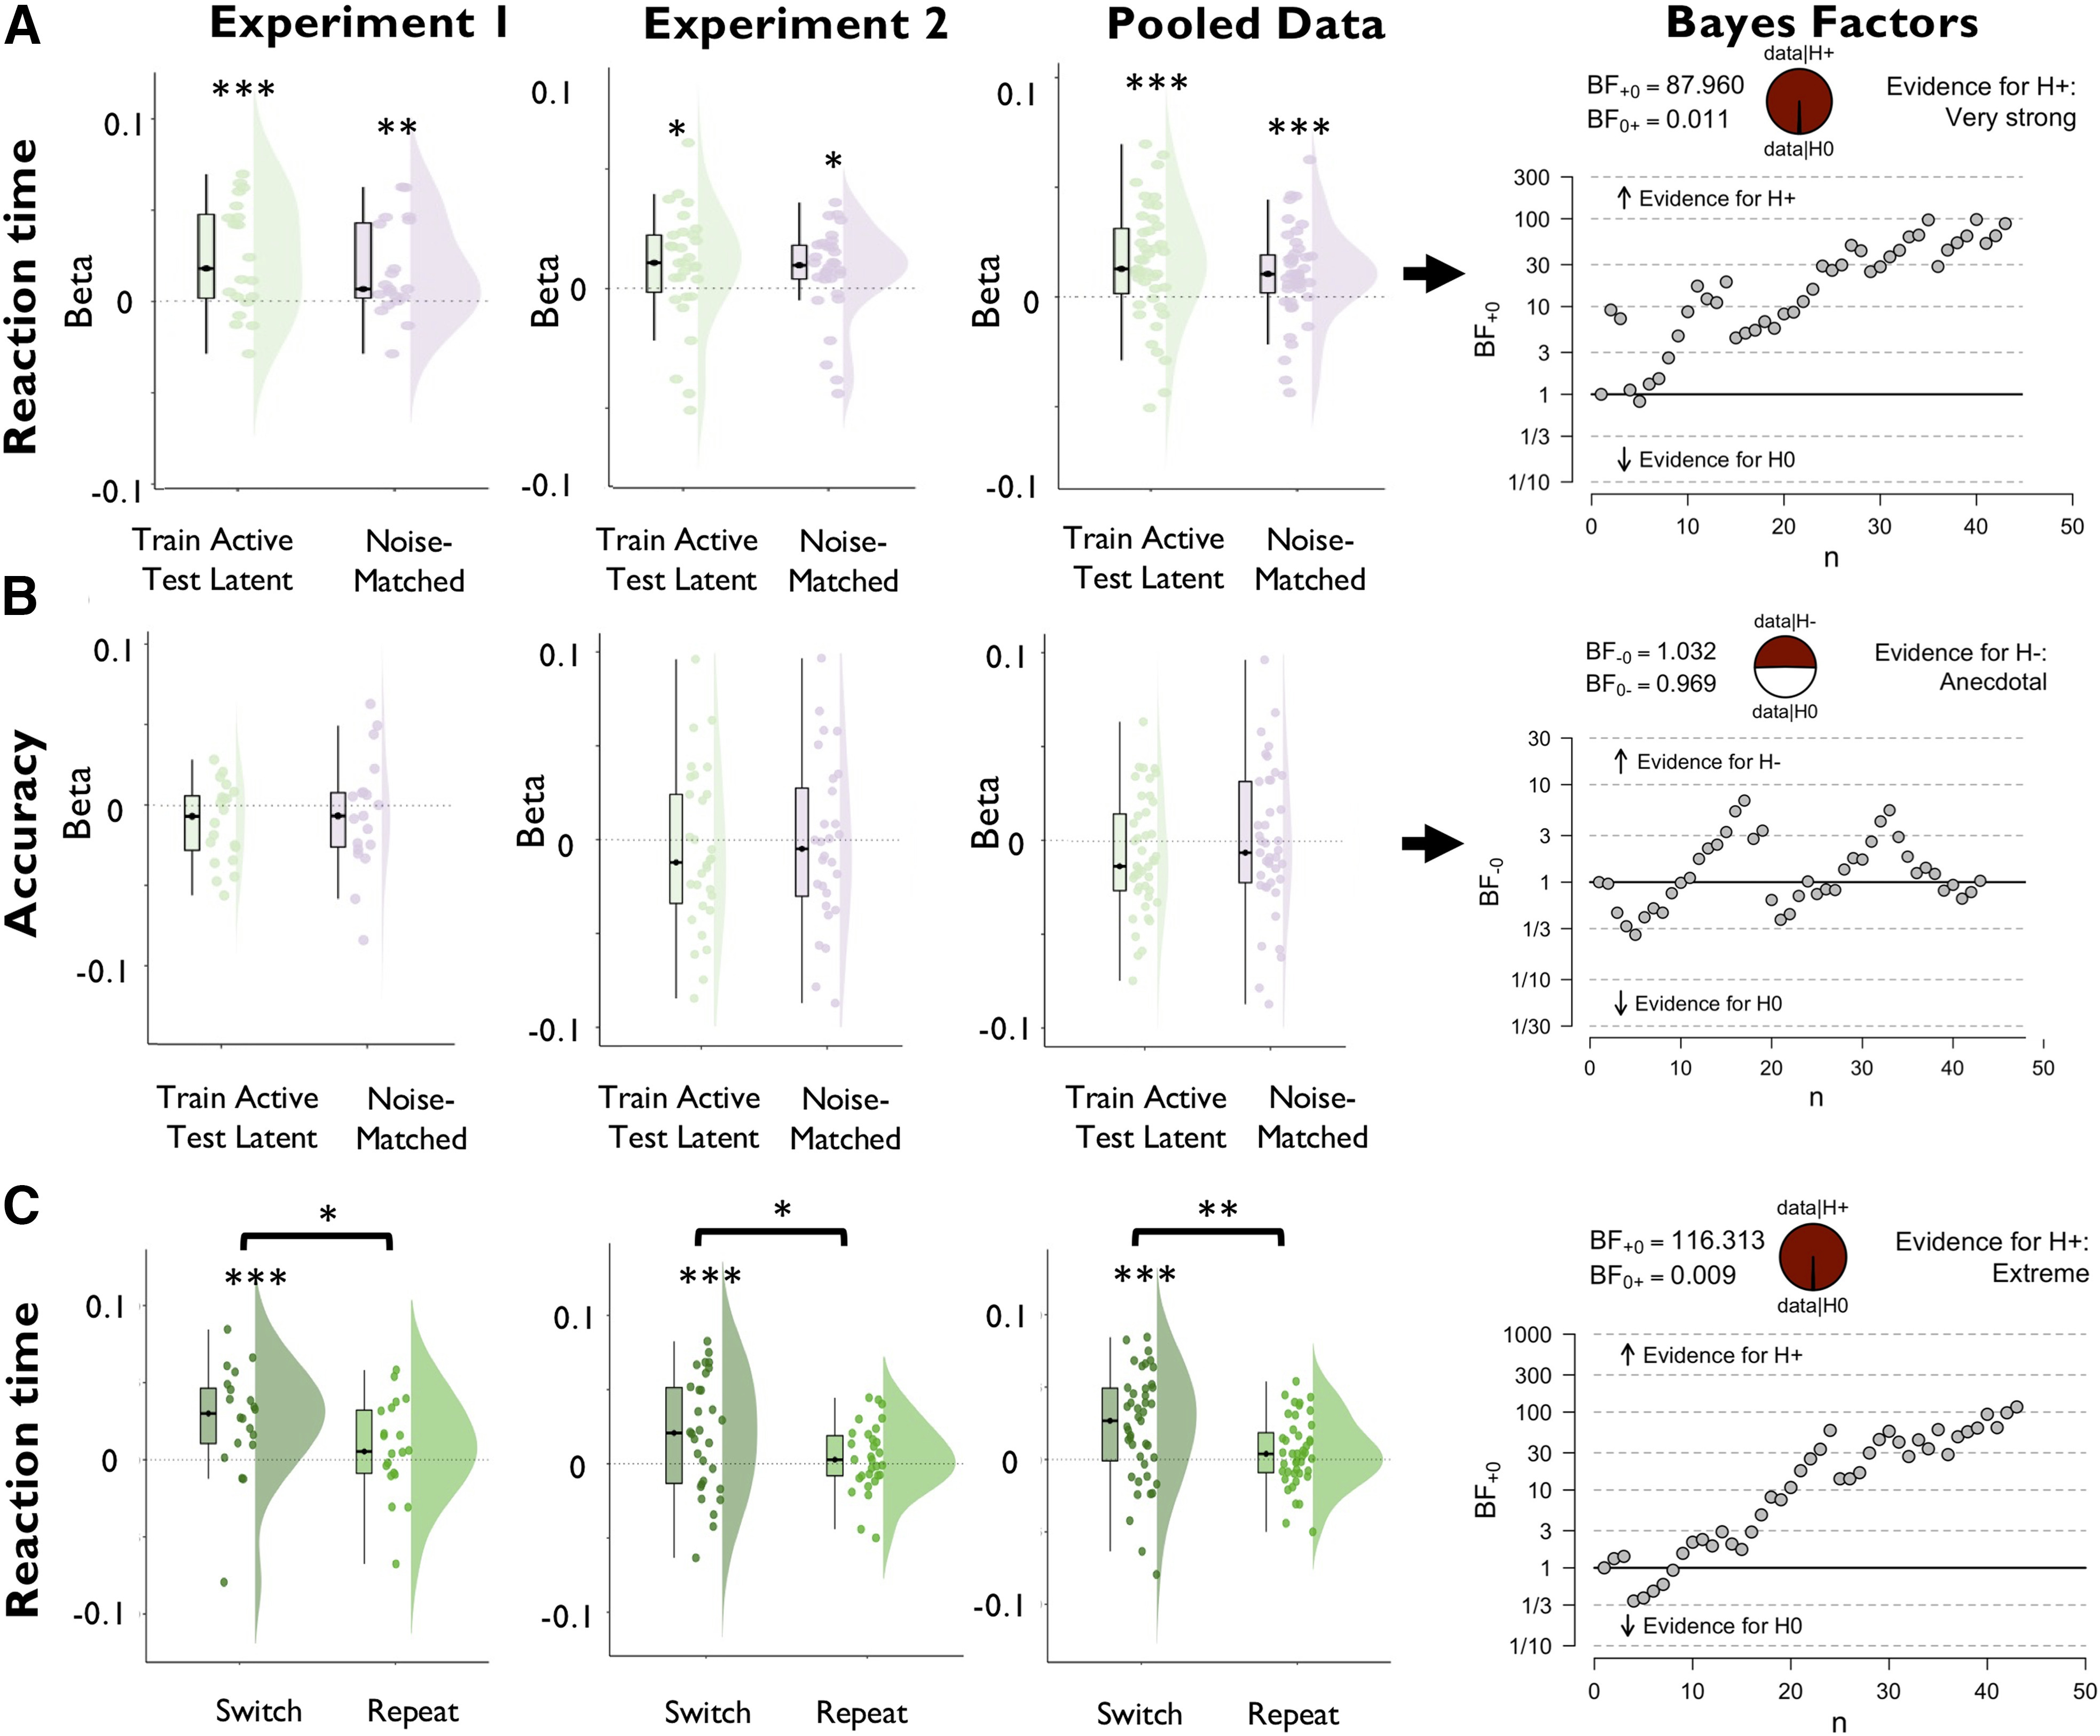
Figure 7.

Regression of task performance based on trial-wise variance in the decoding strength of a cross-item decoder that was trained on the data sorted by the cued WM item and tested on the data sorted by the uncued WM item. Results are shown separately for experiment 1, experiment 2, and the pooled data across experiments. A, B, The cross-item decoder reliably predicted slower reaction time (A, green plots), but was unrelated to accuracy (B, green plots). Notably, the RT effect remained significant after adding noise to cross-item decoder output to match it in signal strength with the regular decoder of the uncued item by adding noise to the decoder output (purple plots; see Materials and Methods). C, Reaction time effects of the cross-item decoder were observed only on trials that required a priority shift between WM items relative to the previous trial (switch trials), but not on trials in which the item priority was repeated (repetition trials). Plots display the distribution of regression weights across participants. Boxplots, Center lines indicate the median, the box outlines indicate the 25th and 75th percentiles, and the whiskers indicate 1.5 times the interquartile range. Plots on the right display sequential Bayes factors for the respective regression weights (based on the pooled dataset of the cross-item decoder). ***p < 0.005, **p < 0.01, *p < 0.05.
