
Figure 1.
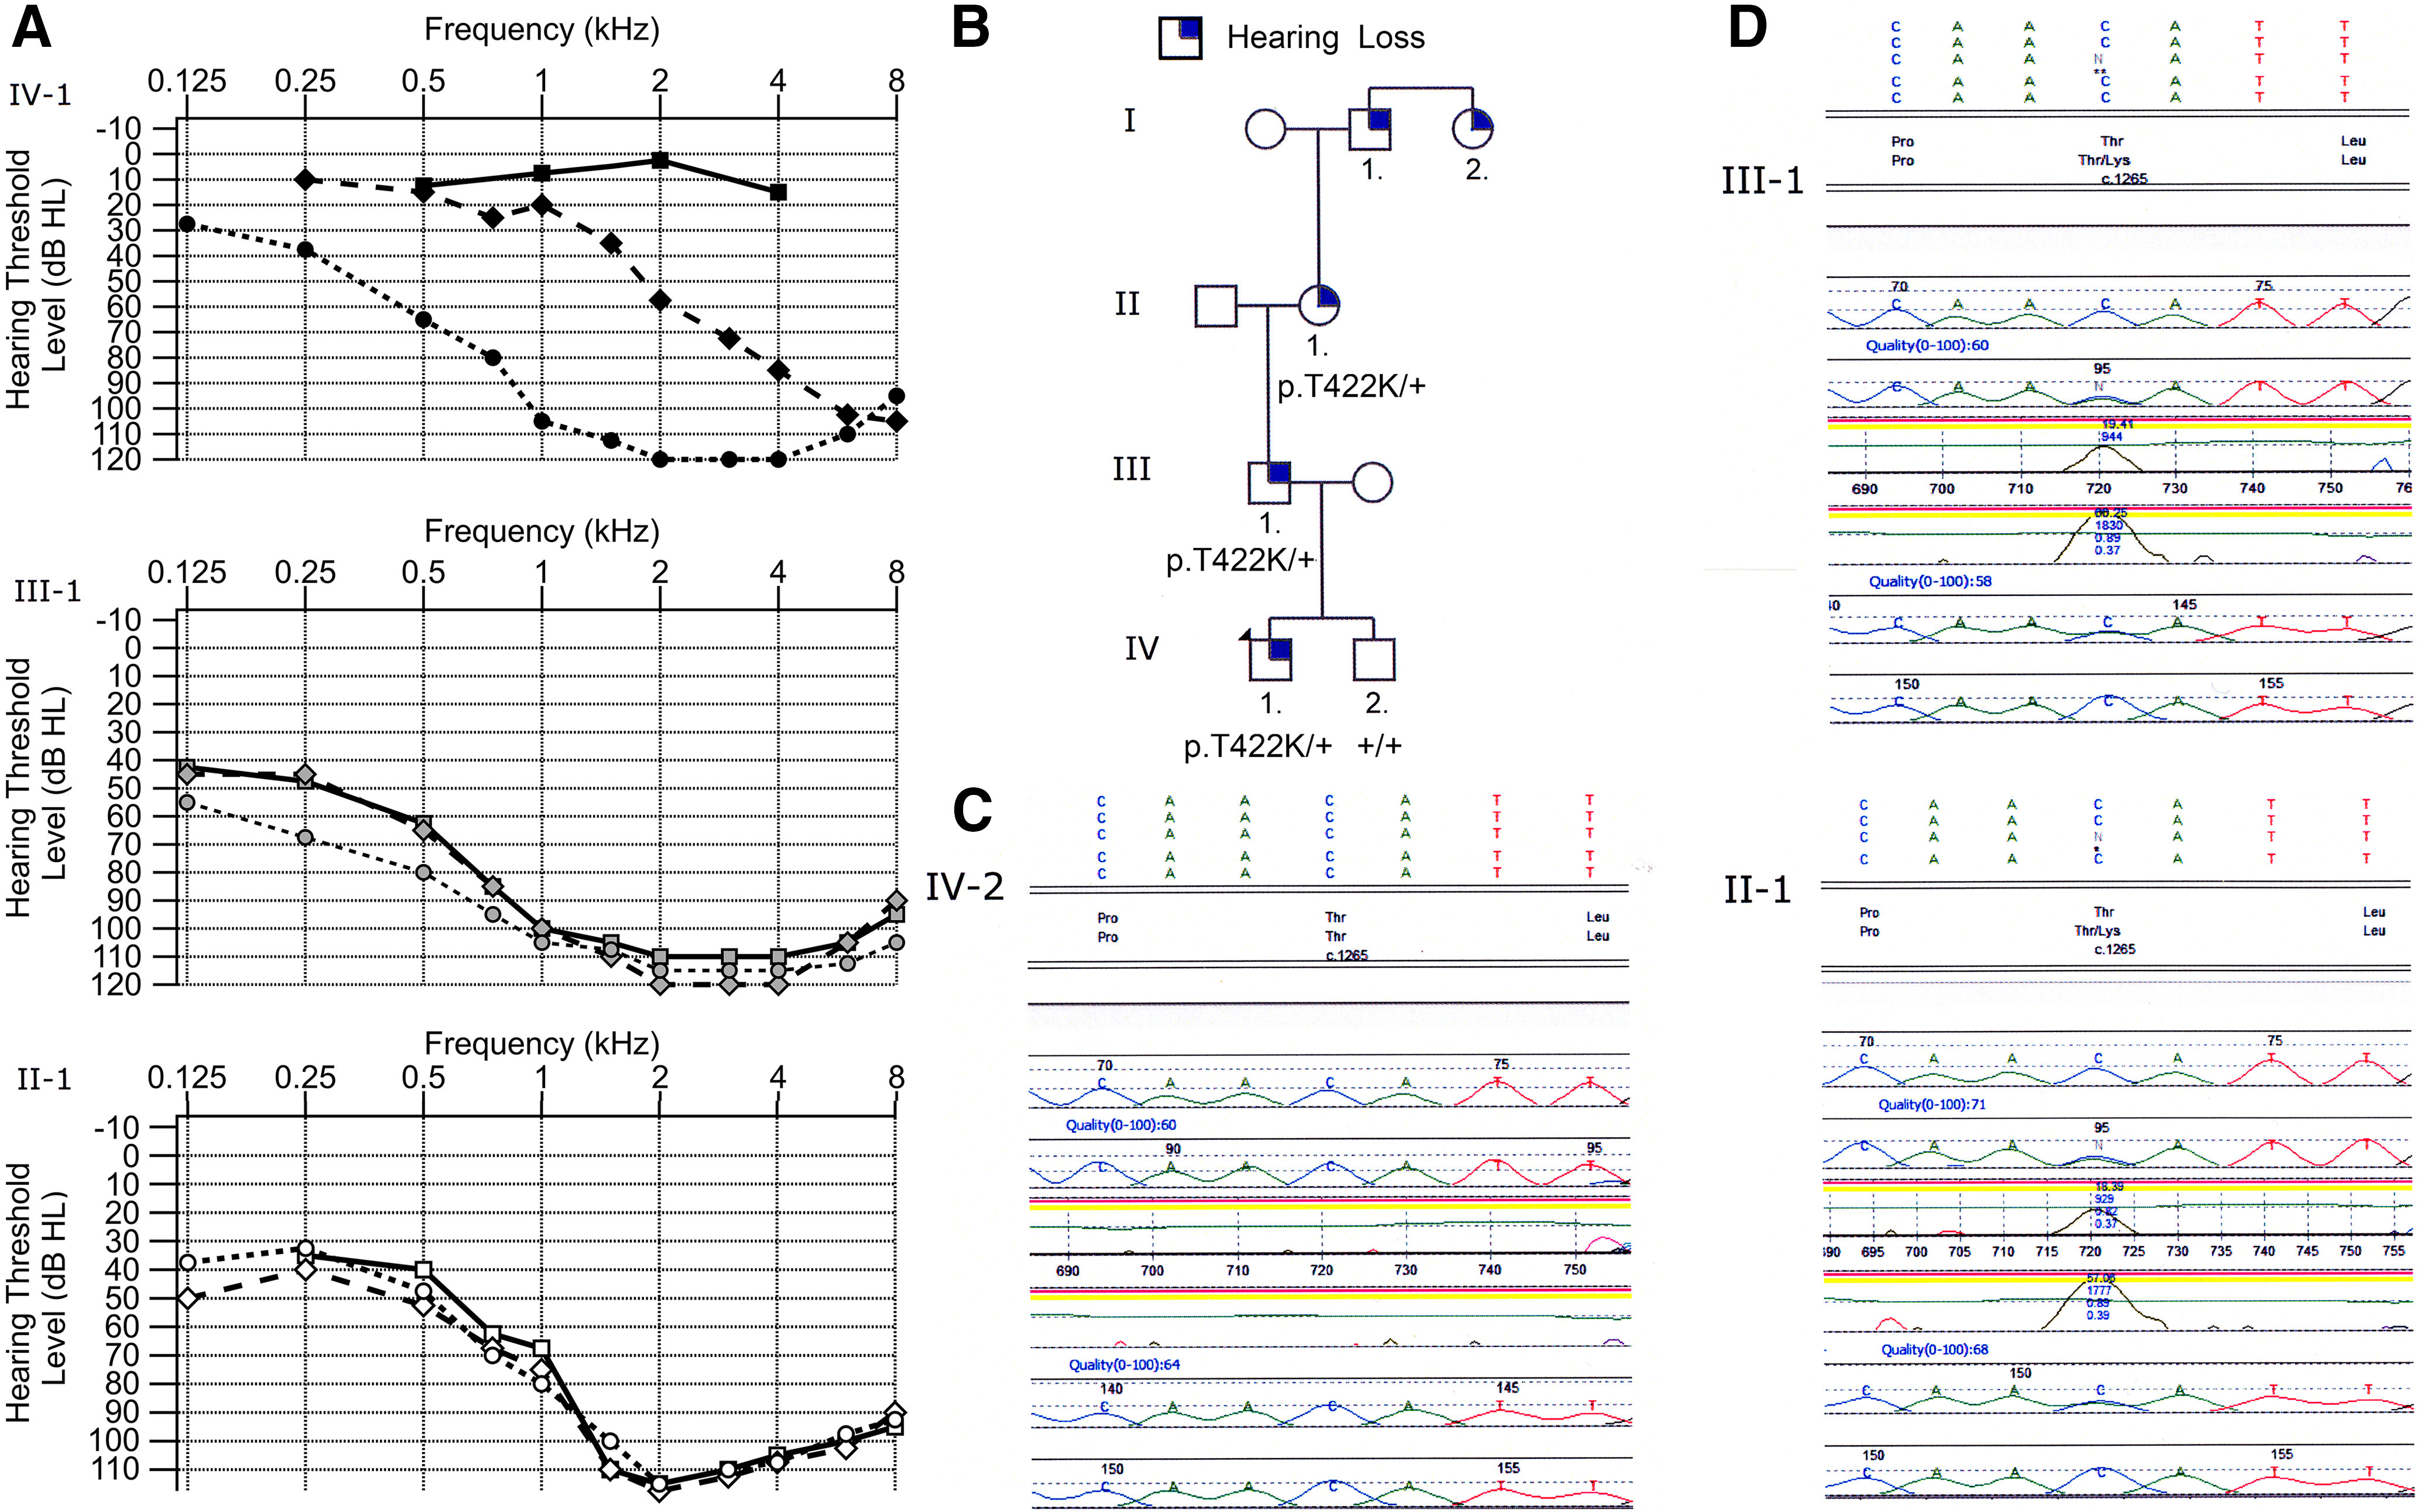
Genotype and phenotype of family. A, Audiogram of the proband (top graph with filled in black markers), father (middle graph with filled in gray markers), grandmother (bottom graph with unfilled markers). Three time points are indicated (T1, rectangle; T2, diamond; T3, circle) for each individual. Each point on the graph is the average hearing threshold from the right and left ear. The proband was five years old at T1 and shows normal hearing at 0.5, 1, 2, and 4 kHz. At the second evaluation (T2), the patient was 11 years old and shows normal hearing from 0.25 to 1 kHz with hearing loss starting at 1.5 kHz. At T3, the patient was 14 years old and illustrates profound to severe hearing loss at all of the frequencies. The father shows moderate to profound hearing loss at all time points. Father was 37 years old at T1, 38 years old at T2, and 39 years old at T3. The grandmother also shows moderate to profound hearing loss at all frequencies. Her age was 57 years old at T1 and 58 years old at T2 and T3. B, Pedigree of the family indicating autosomal dominant transmission pattern. Circles are indicative of a female and squares of a male. An individual with a filled in blue corner indicates that they report some degree of hearing loss. C, DNA sequencing data for unaffected brother. D, DNA sequencing data for father III-1 and grandmother II-1 both with hearing loss.