Figure 3.
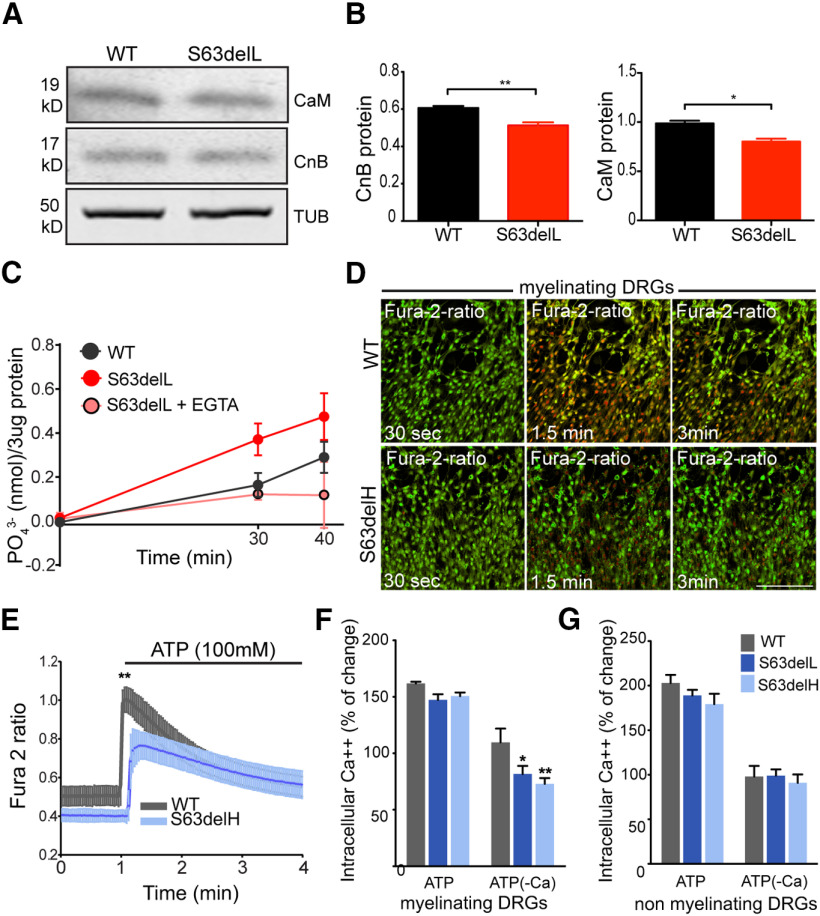
Calcineurin activity is increased in S63del nerves. A, WB analysis revealed CaM and CnB in WT and S63del nerves from P28 mice. β-Tubulin (TUB) represents the loading control. B, Graphs represent the quantification of the WB for CnB (left) and CaM (right). Error bars indicate SEM. *p < 0.05; **p < 0.01; Student's t test. n = 3. C, Calcineurin activity was measured in WT and S63del nerves using a colorimetric assay with malachite green. Three nerves were pulled from each genotype to generate one sample lysate, and 3 μg of lysate was used for the enzymatic assay (Enzo Life Sciences). As control S63del nerve, lysates were incubated with 20 mm EGTA to chelate calcium before enzymatic assay. The kinetic was measured at 30 and 40 min. Graph represents 3 separate experiments. n = 3-6 sample lysate per condition. D-G, Myelinating (D–F) and nonmyelinating (G) DRG explants from WT, S63delL, and S63delH embryos (E13.5) were incubated with 4 μm fura-2 AM and treated with ATP (100 mm) in media with or without calcium (–Ca). D, Frames from time lapse imaging of myelinating DRG Schwann cells from WT and S63delH mouse embryos cultured in calcium-free media to monitor changes of intracellular calcium concentration after 30 s, 1.5 and 3 min of 100 mm ATP treatment, using fura-2 AM ratio. Red represents increased calcium concentration. Scale bar, 8 μm. E, Calcium dynamics in myelinating WT and S63delH DRGs represented in D and quantified in F. Error bars indicate SD. n = 30 Schwann cells per genotype. **p < 0.01 (Student's t test). F, G, Columns represent the mean of percentage of calcium change from basal to ATP-induced levels, measured as change in fura-2 ratio during time lapse imaging (D). Error bars indicate SEM. n = 3. *p < 0.05; **p < 0.01; Student's t test.

