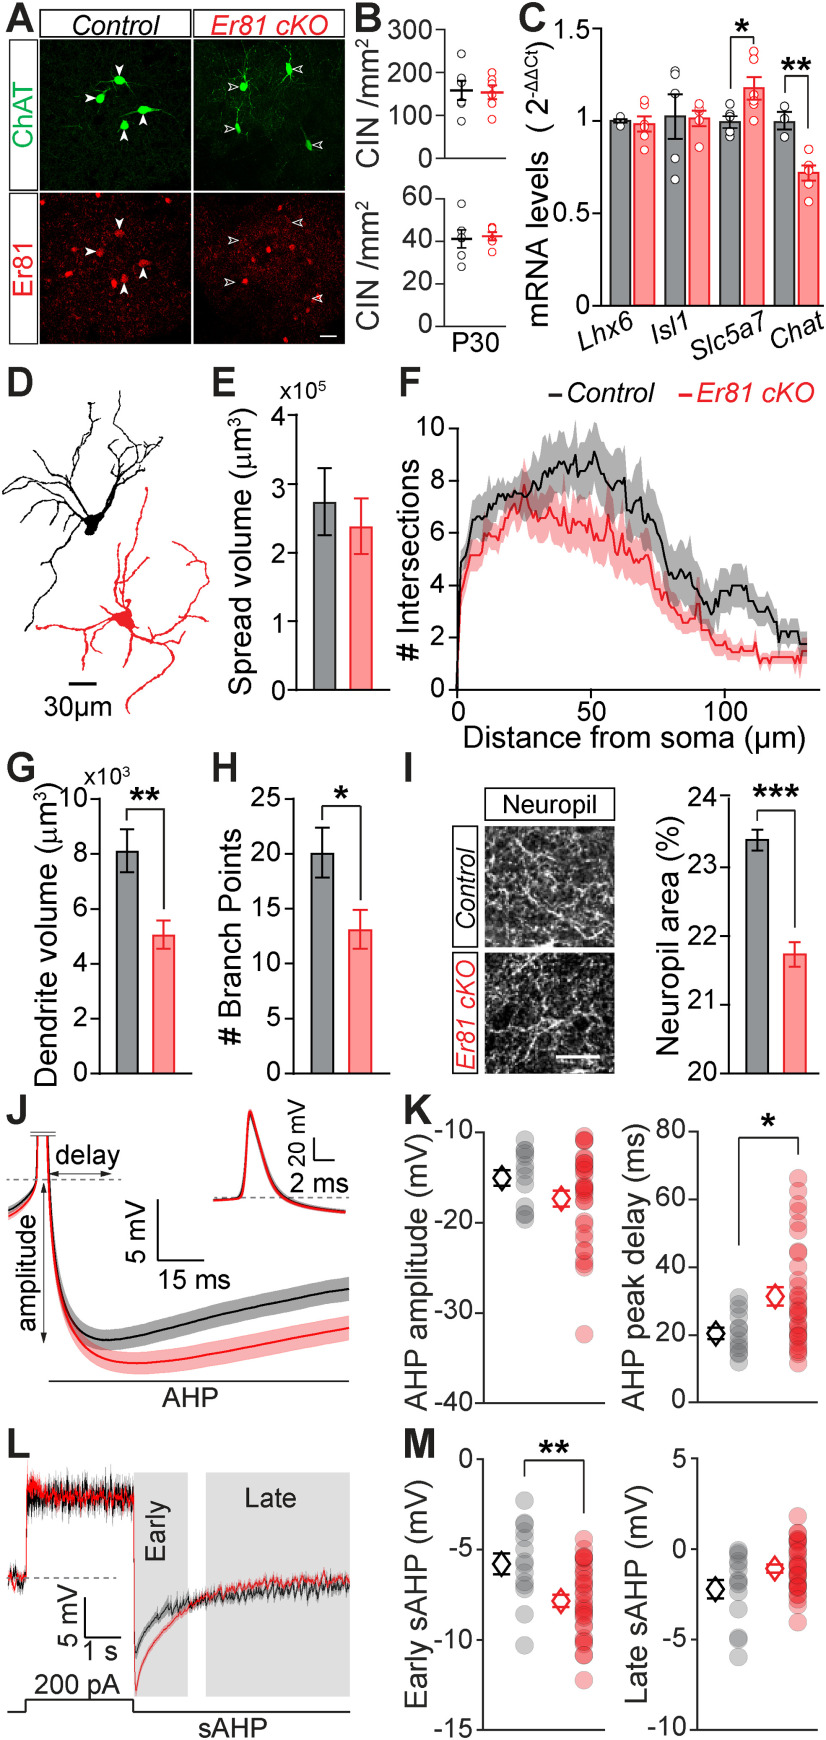
Figure 2.
Alterations of the CIN properties in the absence of Er81. A, ChAT+ interneurons in P30 striatum of a control (ChAT-Cre; Er81+/+, left) and an Er81 cKO (ChAT-Cre; Er81f/f, right) mouse. Scale bar, 25 µm. B, CIN density in the dorsal striatum at P2 (top) and P30 (bottom) in the Er81 cKO compared with the control condition. C, Expression of key molecular markers of cholinergic cells in control and Er81 cKO conditions. Lhx6, LIM homeobox 6; Isl1, Islet1; slc5a7, choline transporter; ChAT, choline acetyltransferase. D, Morphologic reconstruction of soma and dendrites of control (black) and Er81 cKO (red) CINs at P30. E, Volume of dendritic spread in the control and the Er81 cKO CINs. F, Sholl analysis representing the complexity of the dendritic field in the control and the Er81 cKO. G, Total dendritic volume in the control and the Er81 cKO CINs. H, Number of dendritic branch points in the control and the Er81 cKO CINs. I, Left, ChAT+ neuropil. Right, Quantification of the area occupied by ChAT+ neuropil in the striatum. J, Grand average AHP waveforms (±SEM) in the control (black) and the Er81 cKO (red). Inset, The AP. Dashed line indicates the AP threshold. AHP delay and amplitude were determined from individual APs. K, AHP amplitude (left) and AHP peak delay (right) in the control and the Er81 cKO mice. Each dot represents the average AHP amplitude per cell. L, Average membrane potential (±SEM) during and after a 200 pA current injection. Individual traces were aligned to the resting membrane potential (dashed line). Gray shadings represent early and late phases of the slow AHP. M, Average of the early (left) and the late phase of the slow AHP (right) in the two conditions. *p < 0.05; **p < 0.01; ***p < 0.001.

