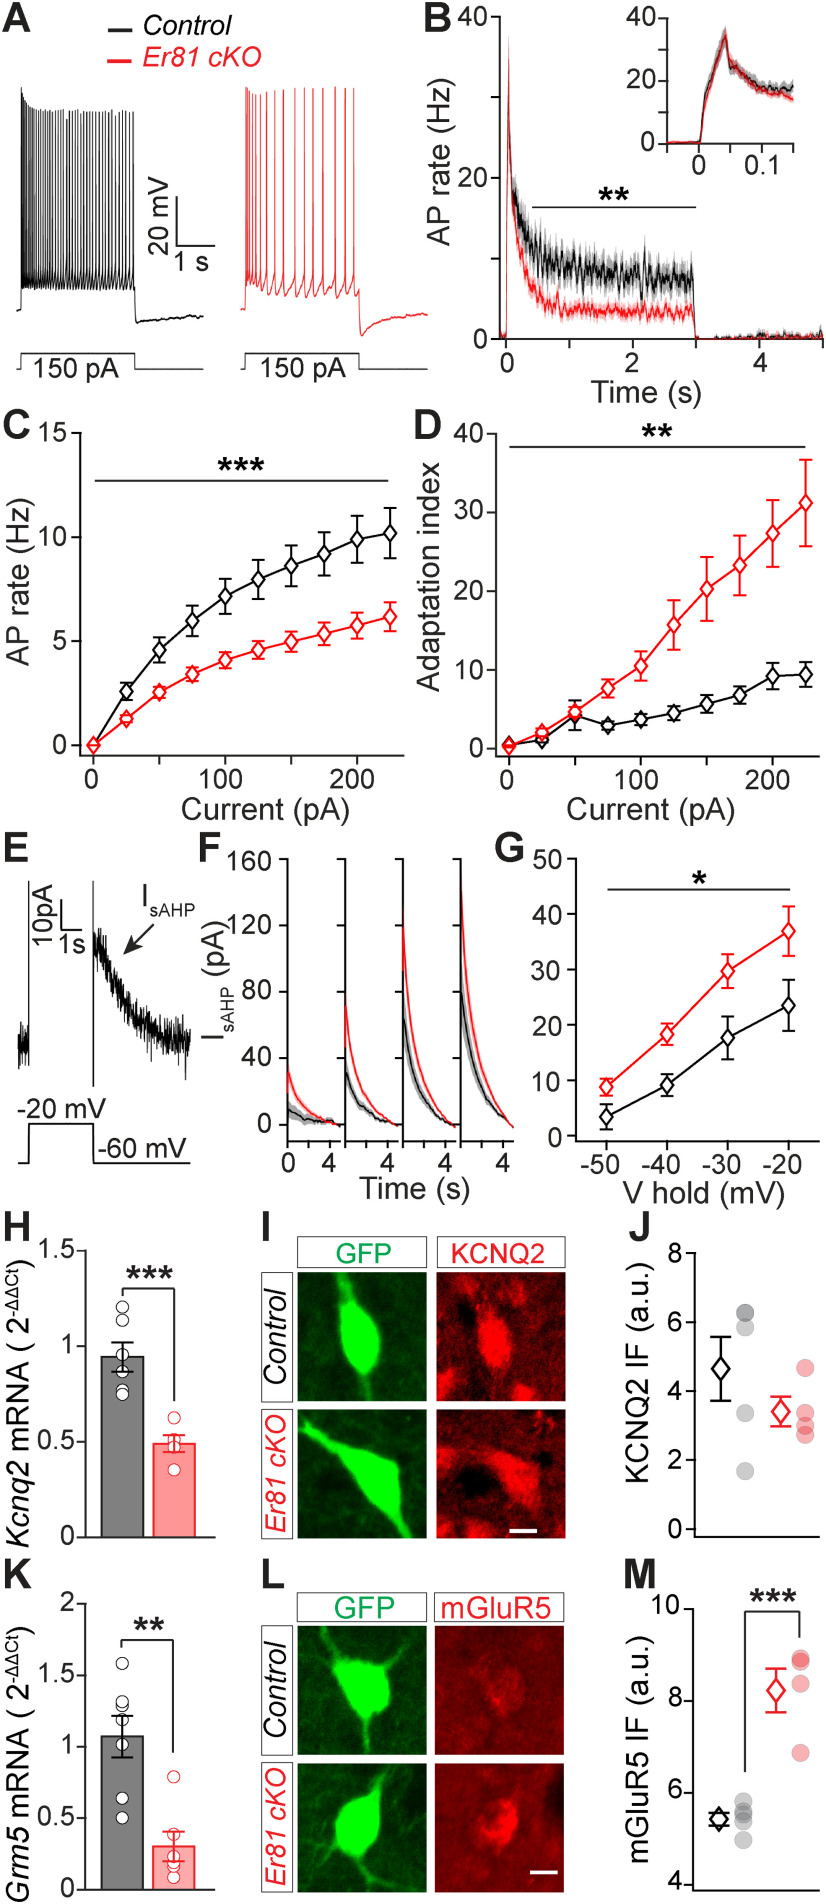
Figure 3.
Reduced CIN excitability and enhanced delayed rectifier current IsAHP following Er81 deletion. A, Representative responses of P30 CINs to a 150 pA positive current pulse in the control and the Er81 cKO conditions. B, Average AP rate across all positive current pulses. Inset, Time-expanded view of the early response. C, Average AP rate during positive current steps. Stars represent genotype effect. D, Adaptation index as a function of the current step amplitude. Stars represent genotype effect. E, Example trace of the putative IsAHP following a depolarizing voltage pulse. F, Mean traces of IsAHP (±SEM) as a function of time at different holding potentials (−50 to −20 mV, 10 mV steps). G, Average IsAHP as a function of the holding potential. Stars represent genotype effect. H, Kcnq2 mRNA expression levels in the striatum of control and Er81 cKO mice. I, Representative image of a ChAT-GFP cell (green) stained for KCNQ2 protein (red) in control and Er81 cKO. Scale bar, 10 µm. J, Average KCNQ2 protein expression levels in control and Er81 cKO CINs. K, Grm5 mRNA expression levels in the striatum of the control and the Er81 cKO mice. L, Representative image of a ChAT-GFP cell (green) stained for mGluR5 protein (red) in control and Er81 cKO. Scale bar, 10 µm. M, Average mGluR5 protein expression levels in control and Er81 cKO CINs. *p < 0.05. **p < 0.01. ***p < 0.001.

