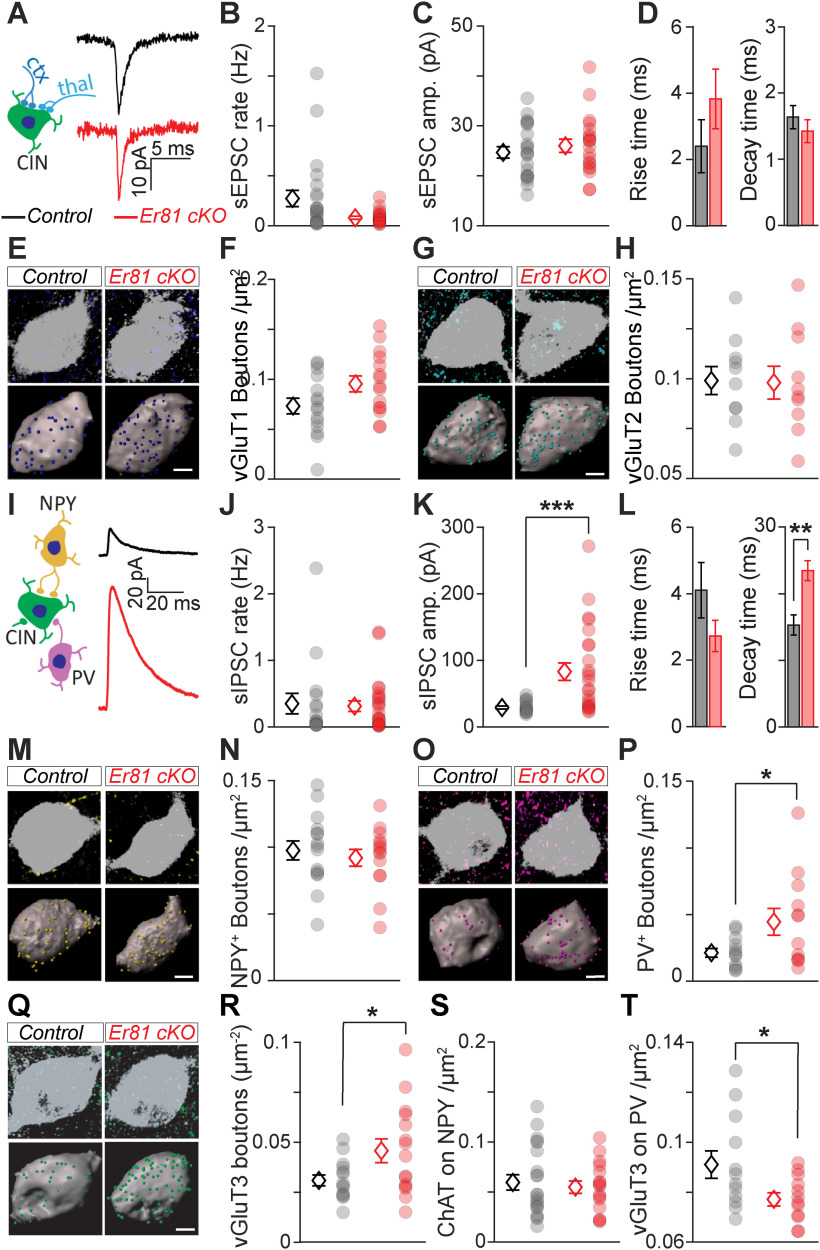
Figure 5.
Rewiring of the CINs in the absence of Er81. A, Left, Excitatory inputs to CINs from cortex (ctx, dark blue) and thalamus (thal, light blue). Right, Average sEPSC traces of a control and Er81 cKO CIN. B-D. Rate (B), amplitude (C), rise time (D, left), and decay time (D, right) of sEPSCs in control and Er81 cKO CINs. E, Top, Control and Er81 cKO CINs (ChAT, gray) with vesicular glutamate transporter 1 (vGluT1, dark blue, cortical boutons). Bottom, 3D reconstruction of control and Er81 cKO CINs soma (gray) and vGluT1 boutons (spots). F, vGluT1 bouton density on control and Er81 cKO CINs. G, Control and Er81 cKO CINs (ChAT, gray) with vGluT2 boutons (light blue, thalamic boutons). Details as in E. H, vGluT2 bouton density on control and Er81 cKO CINs. I, Left, Schematic of local inhibitory inputs to CINs from NPY+ (yellow) and PV+ (magenta) interneurons. Right, Average spontaneous sIPSC traces of a control and Er81 cKO CIN. J-L. Rate (J), amplitude (K), rise time (L, left), and decay time (L, right) of sIPSCs in control and Er81 cKO CINs. M, Control and Er81 cKO CINs with NPY+ boutons (yellow). Details as in E. N, NPY+ bouton density on control and Er81 cKO CINs. O, Control and Er81 cKO CINs with PV+ boutons (magenta). Details as in E. P, PV+ bouton density on control and Er81 cKO CINs. Q, Control and Er81 cKO CINs with vGluT3+ boutons (green, cholinergic boutons). Details as in E. R, vGluT3+ bouton density on control and Er81 cKO CINs. S, ChAT+ bouton density on NPY+ interneurons in control and Er81 cKO conditions. T, ChAT bouton density on PV+ interneurons in control and Er81 cKO conditions. Diamonds represent averages. Circles represent individual neurons. Scale bars, 5 µm. *p < 0.05. **p < 0.01. ***p < 0.001.

