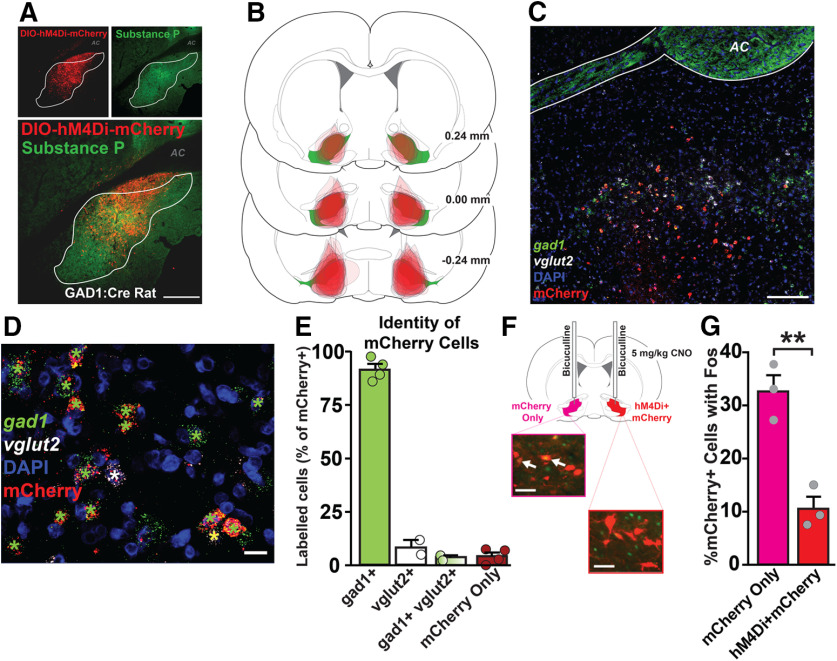
Figure 1.
Anatomical, cellular, and functional characterization of hM4Di DREADDs in VPGABA neurons. A, Localization of DIO-hM4Di-mCherry in substance P-defined VP borders. Top left, DIO-hM4Di-mCherry in VP. Top right, Substance P demarcates VP from surrounding basal forebrain. Bottom, Merged DIO-hM4Di-mCherry and substance P image. AC, Anterior commissure. Scale bar, 400 μm. B, Mapping of viral expression for each individual rat expressing hM4Di DREADDs. Numbers indicate rostral/caudal coordinates relative to bregma. Green represents substance P-defined VP. Red represents DIO-hM4Di-mCherry expression. C, RNAscope FISH for gad1, vglut2, and mcherry mRNA, with DAPI costain. Scale bar, 200 μm. D, Higher magnification of mRNA signal. Scale bar, 20 μm. Green star represents mCherry+gad1. White star represents mCherry+vglut2. Yellow star represents mCherry+gad1+vglut2. E, Identity of mCherry cells in VP. mCherry colocalized largely with gad1 mRNA (green bar), with few mCherry+ neurons expressing vglut2 mRNA. A small population of mCherry+ neurons expressed both gad1 and vglut2 (green + white gradient), and some cells lacked observable gad1 or vglut2 mRNA and only expressed mCherry (red). F, Schematic illustrating bilateral bicuculline (0.01 μg/0.5 μl) microinjection and systemic CNO (5 mg/kg) in rats with ipsilateral mCherry and contralateral hM4Di+mCherry in VPGABA neurons (left: green represents Fos; red represents mCherry; right: green represents Fos; red represents hM4Di+mCherry). White arrows indicate colocalization of Fos in mCherry+ neurons. Scale bars, 40 μm. G, CNO reduced %mCherry+ cells colocalized with Fos in hM4Di+mCherry neurons, compared with contralateral mCherry only neurons. **p < 0.01 (independent sample t test). Data are mean ± SEM. Dots represent individual rats.

