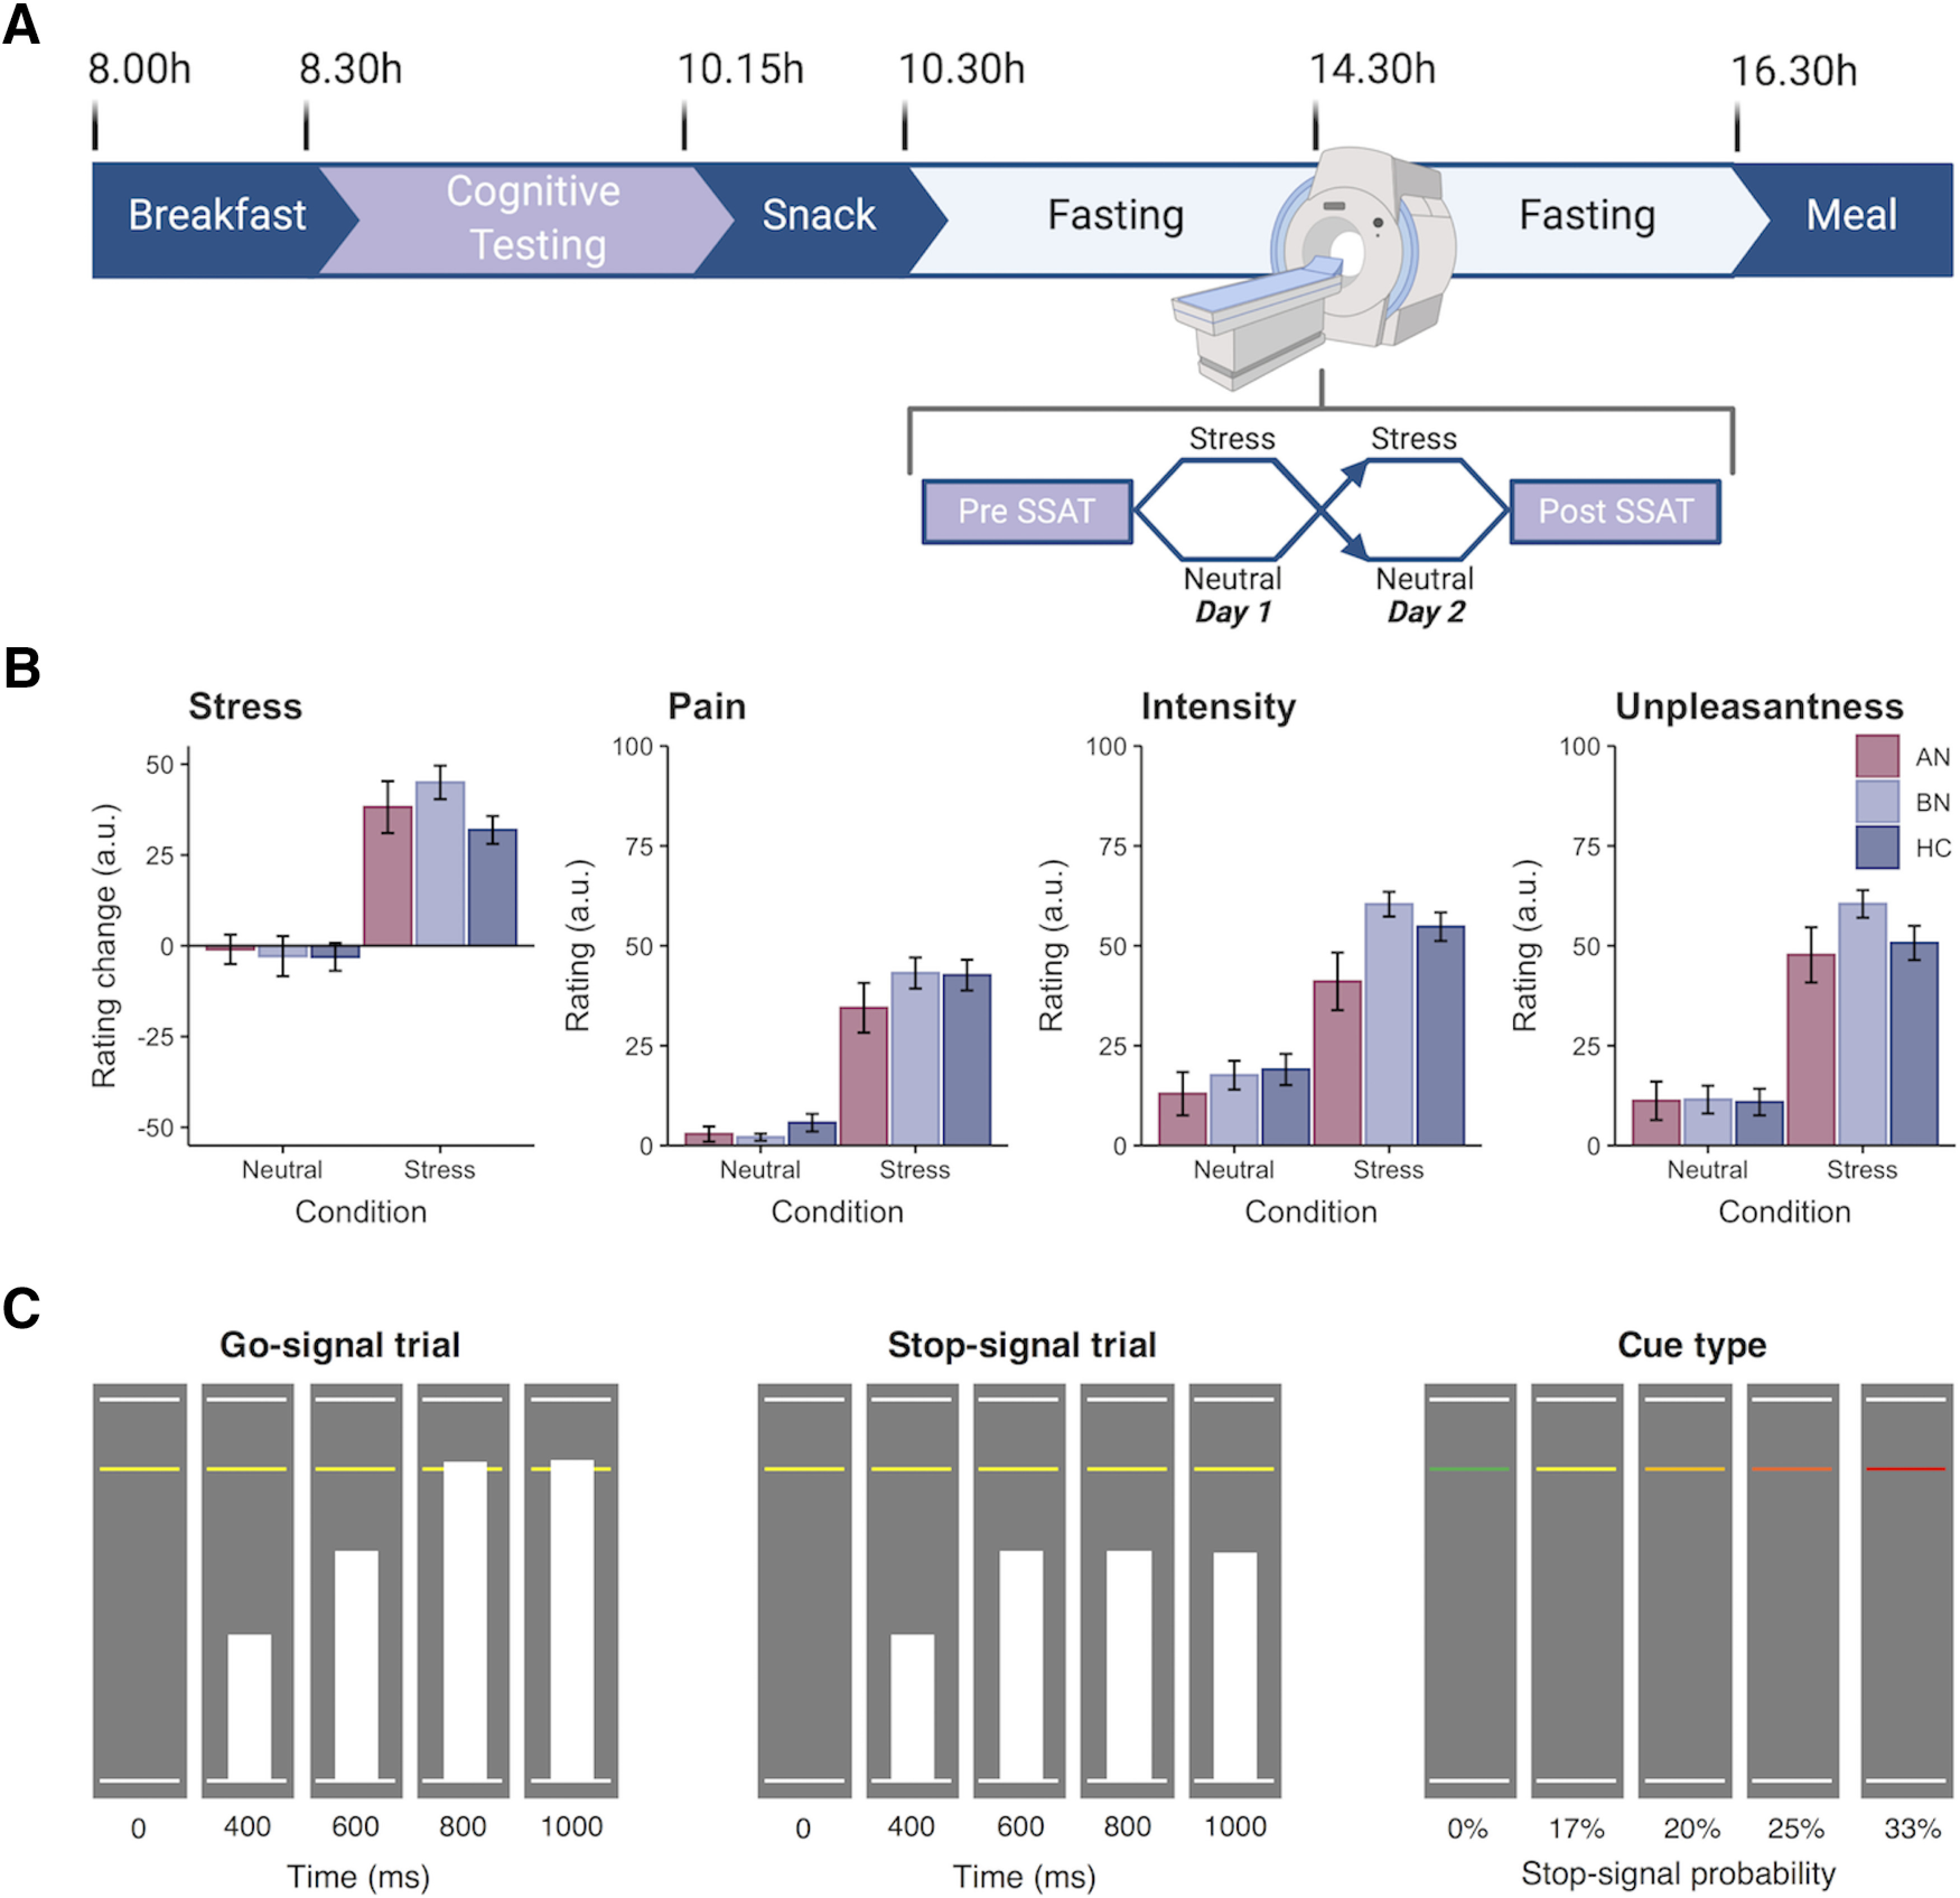
Figure 1.

Overview of study design and Stop-signal anticipation task. A, Diagram of inpatient study protocol with representative timeline. Participants were randomized to either a stress induction or control task on each day, which was completed in the MR scanner. Created with BioRender.com. See Extended Data Figure 1-1 for plasma cortisol responses (percentage change from baseline) to the stress and control tasks. B, Participant ratings of subjective stress and electrical stimulation. The stress manipulation induced a significantly greater change in subjective stress compared with the neutral task. Participants rated the electrical stimulation as more painful, intense, and unpleasant following stress as compared with the control task, where stimulation was intended to be detectable but not unpleasant (Westwater et al., 2020). Ratings did not differ significantly by group (all p values >0.05). Error bars indicate the SEM. C, Schematic of SSAT trial types adapted from Zandbelt and Vink (2010). Left, On Go-signal trials, participants were instructed to respond when a moving bar reached the middle line. The target response time was 800 ms on each 1000 ms trial (1000 ms intertrial interval). Middle, A minority of trials (25%) were Stop-signal trials, where the moving bar stopped automatically before reaching the middle line. Participants were instructed to withhold their response in the event of a Stop-signal. Right, To index proactive inhibition, the probability of a Stop-signal occurring on a given trial ranged from 0% to 33%, as indicated by colored cues. Participants were told that Stop-signals would never occur on green (baseline) trials, but the likelihood of a Stop-signal occurring increased across yellow to red trials.
