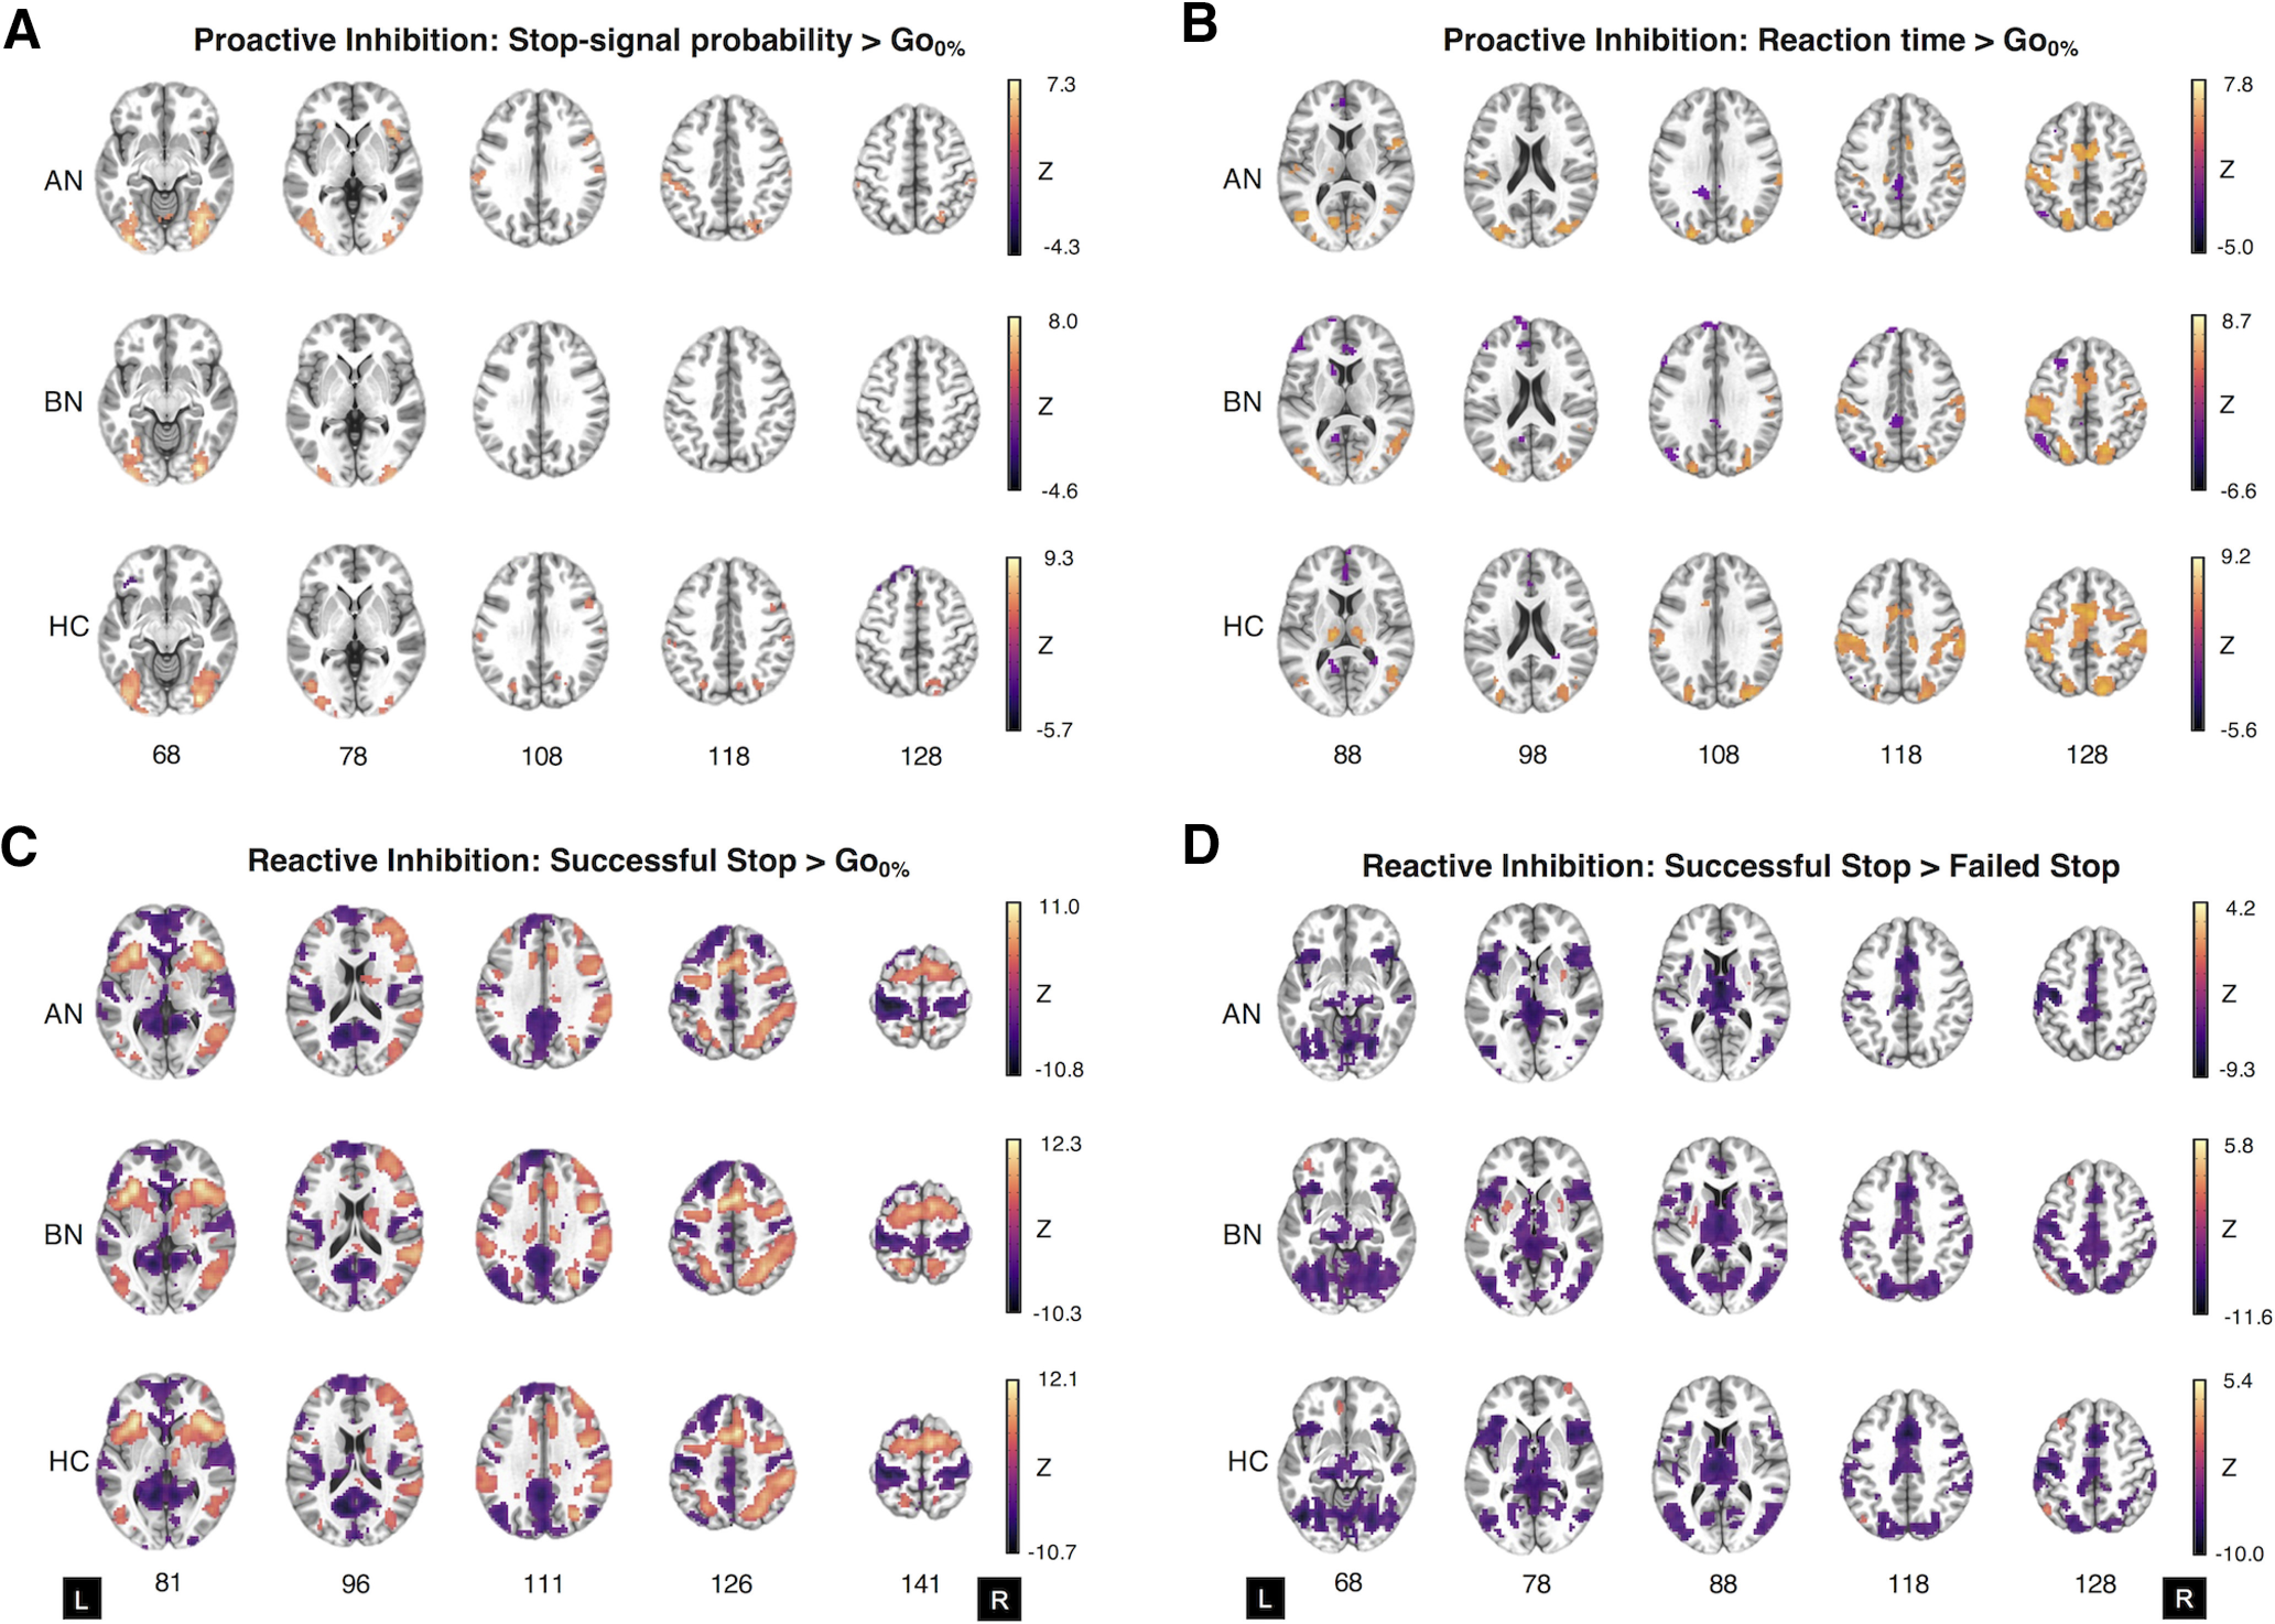
Figure 3.

Whole-brain activation in women with anorexia nervosa and bulimia nervosa, and control participants during the Stop-signal anticipation task. A–D, Two-sample t tests of the parametric effect of Stop-signal probability versus the implicit baseline (i.e., Go0% trials; A), the parametric effect of reaction time versus the implicit baseline (B), successful Stop-signal versus the implicit baseline (C), and successful Stop-signal versus failed Stop-signal activation for AN-BP, BN, and control groups (D). A and B represent proactive inhibition contrasts, whereas C and D relate to reactive inhibition. Maps represent significant clusters (voxelwise p value < 0.001, FWE cluster probability p value < 0.05) and are presented in neurological orientation (L, left). For details on cluster size, coordinates, and associated test statistics, see Extended Data Figures 3-1, 3-2 3-3, 3-4.
