. 2020 Mar 24;11(15):3914–3922. doi: 10.1039/c9sc05768d

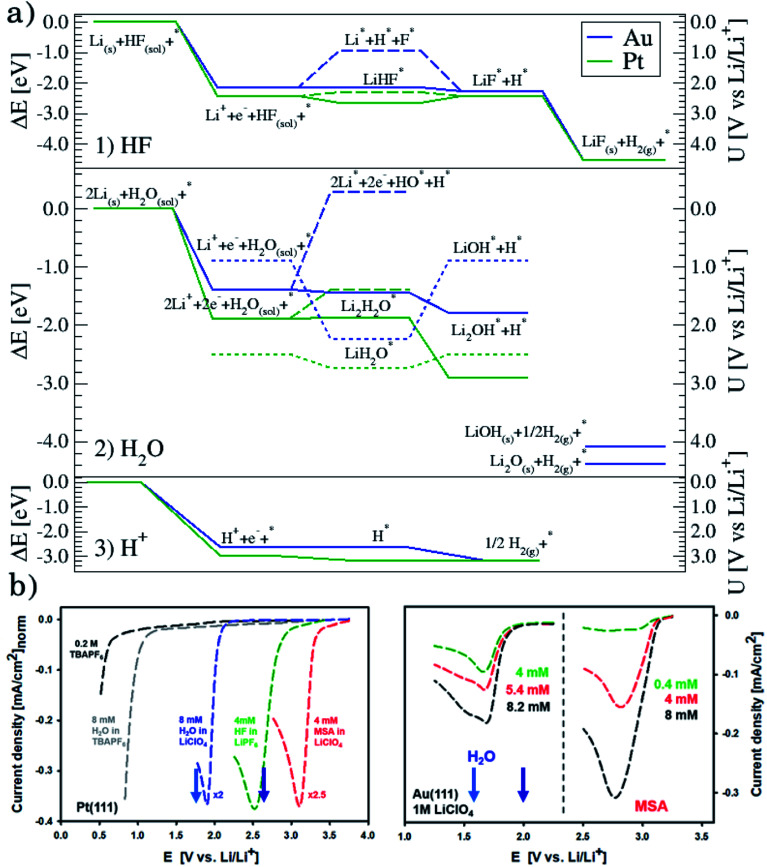
Fig. 2. (a) Reaction paths for the three reactions considered on Au(111), in blue, and Pt(111), in green: H2 formation from HF (1) and from H2O (2), and the structures of the interface are shown in Fig. S5 and from protons (3). (b) Voltammograms in various electrolytes with different concentrations of water and MSA under stagnant conditions: 1 M LiClO4, for both Pt(111) and Au(111) and, only for Pt(111), 0.2 M TBAPF6 (no Li+ cations and water, and HF impurities below 5 ppm), 0.2 M TBAPF6 with added 8 mM water, and 1 M LiPF6, which is included for completeness. Note that for clarity, on Pt(111), the currents are normalized to the value obtained for HF electroreduction. The two arrows in each plot indicate the adsorption potential for 1 and 2 Li (darker and lighter blue, respectively) as calculated from the AIMD simulations. It shows a good correlation between the two response peaks and these values.

Fig. 2