Figure 5.
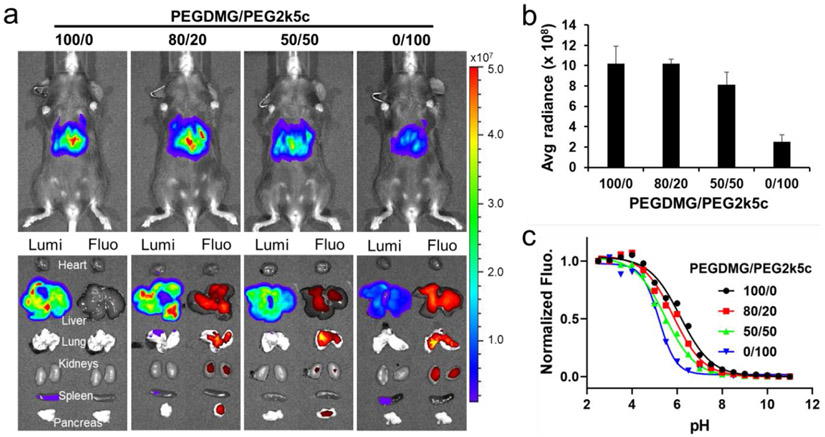
The intensity of mRNA expression in vivo correlated with the pKa of DLNPs. a) C57BL/6 mice were injected i.v. with 0.1 mg kg−1 Luc mRNA in 4A3-SC8 DLNPs containing different mole ratio of PEGDMG and PEG2k5c (n = 2). Bioluminescence was quantified 6 h after injection. b) Quantification of Luc mRNA expression intensity in livers. c) The pKa of PEGDMG/PEG2k5c formulated 4A3-SC8 DLNPs.

