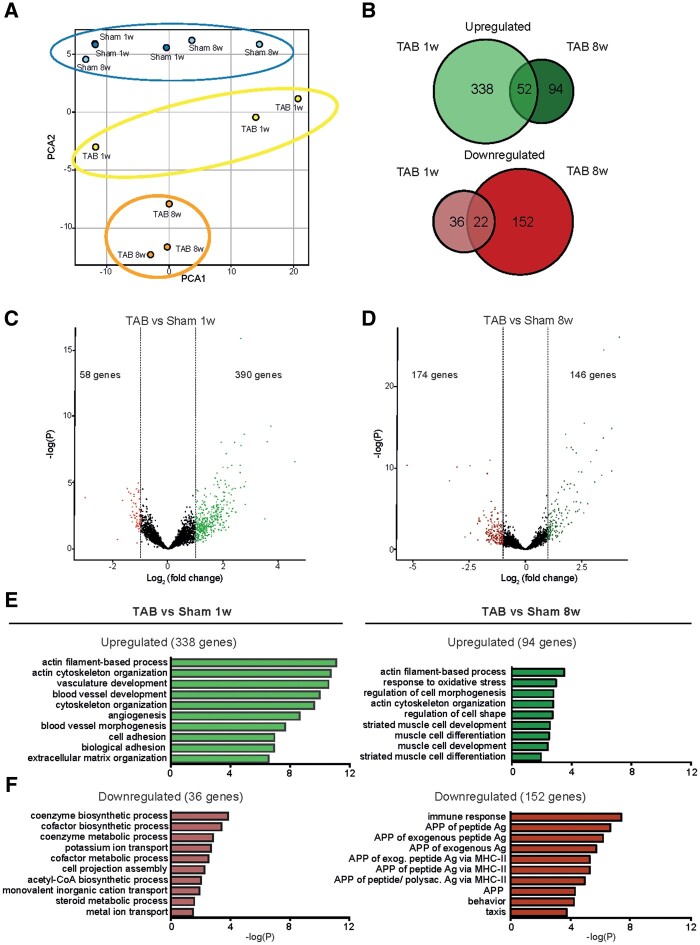
Figure 2.
Bulk RNA sequencing analysis reveals differential gene regulation in hypertrophic and pathological CMs. (A) Principle component analysis (PCA) plot showing the distinct gene expression between groups. (B) Venn diagrams showing the intersection between significantly up-regulated genes (log2FC > 1), upper panel in green, and significantly down-regulated genes (log2FC < −1), lower panel in red, in CMs 1 week (TAB 1w) and 8 weeks (TAB 8w) after TAB when compared with corresponding control (sham 1w and sham 8w), respectively (n = 3 per group). (C) Volcano plot of all genes in TAB 1w samples compared to sham 1w. Significant up-regulated genes based on log2FC > 1; and significant down-regulated genes (red) based on log2FC < −1. (D) Volcano plot of all genes in TAB 8w samples compared to sham 8w. Significant up-regulated genes based on log2FC > 1; and significant down-regulated genes (red) based on log2FC < −1. (E) GO enrichment analysis for the up-regulated genes in CMs from TAB 1w and TAB 8w compared to corresponding control. (F) GO enrichment analysis for the down-regulated genes in CMs from TAB 1w and TAB 8w compared to corresponding control.

