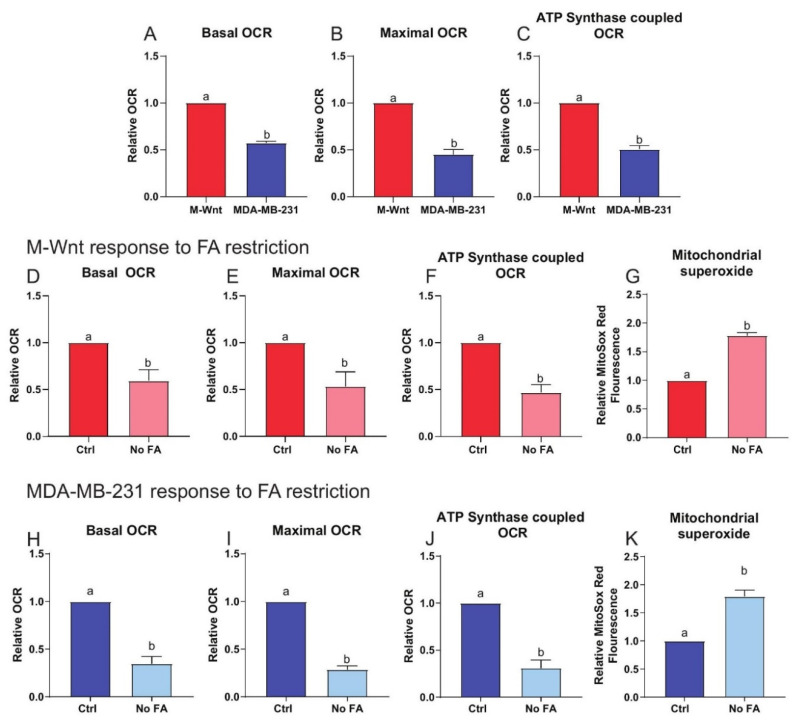
Figure 9.
Innate mitochondrial dysfunction underpins response to FA restriction. Basal (A), maximal (B), and ATP synthase-coupled (C) OCR determined in M-Wnt cells and MDA-MB-231 cells (n = 3/group). Basal (D), maximal (E), and ATP synthase-coupled (F) OCR determined in M-Wnt cells following 3 weeks of culture with or without FA (n = 3/group). Mitochondrial superoxide production (G) determined using MitoSox Red in M-Wnt cells following 3 weeks of culture with or without FA (n = 3/group). Basal (H), maximal (I), and ATP synthase-coupled (J) OCR determined in MDA-MB-231 cells following 3 weeks of culture with or without FA (n = 3/group). Mitochondrial superoxide production (K) determined using MitoSox Red in MDA-MB-231 cells following 3 weeks of culture with or without FA (n = 3/group). Student’s t-test (A–K) used to determine significance (p < 0.05), different letters indicate significant differences.

