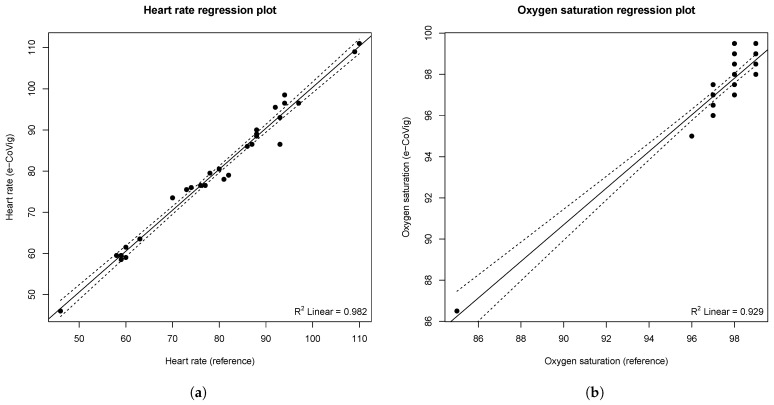
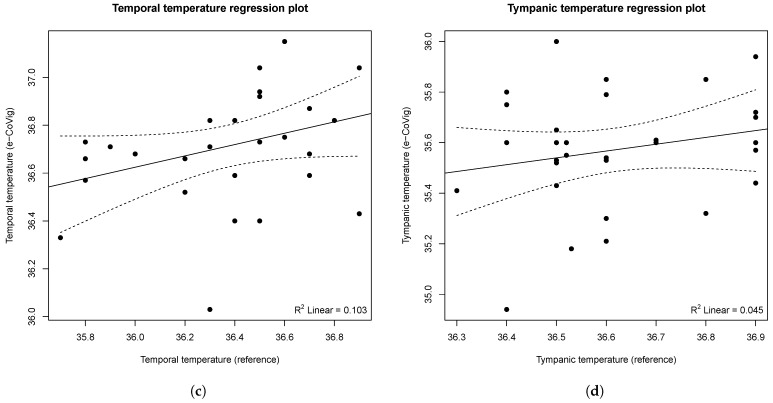
Figure 9.
Regression plots representing the correlation between the measurements with the e-CoVig device and the standard reference device. (a) heart rate (in BPM); (b) (in %); (c) temporal and (d) tympanic temperatures (in °C). The solid line represents the regression line computed using unweighted least squares, while the dashed lines correspond to 95% confidence bands, depicting the upper and lower confidence bounds for all points on the fitted line.


