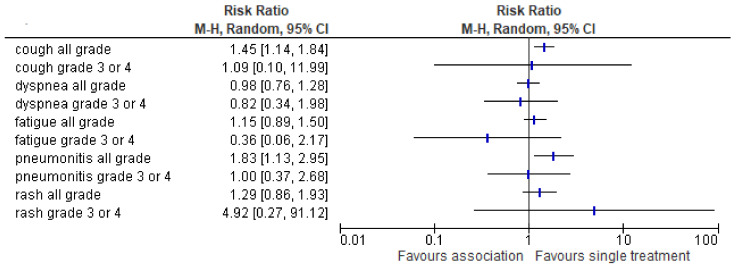
Figure 7.
The risk ratio of the most frequent adverse events in the association treatment group as compared to the single Table 95. confidence interval (CI) for the adverse effect rate are shown on a logarithmic scale. Adverse events are arranged by alphabetic order (all grade AE and 3–4 grade, respectively).

