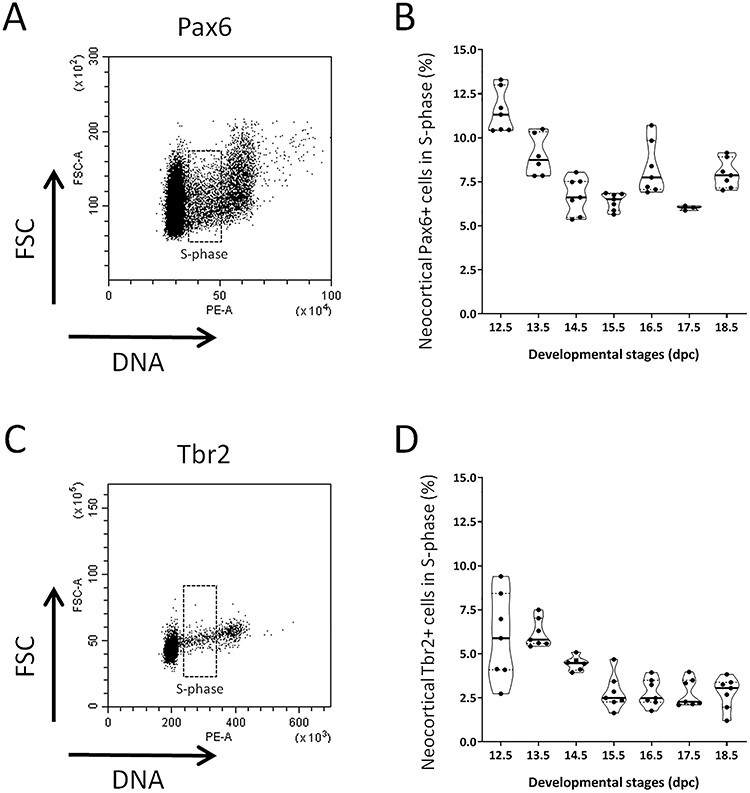
Figure 4 .

Cell cycle parameters for the 2 subtypes of cortical neural progenitors over the course of neocortex development. (A) Representative dot plot of DNA content for Pax6+ cells estimated by PI incorporation (horizontal axis) versus FSC relative cell size (vertical axis) for one E15.5 embryo. Cells in S-phase are highlighted. (B) Distribution of the proportion of Pax6+ cells in S-phase at each developmental stage. Each dot represents one embryo. Violin representation of the data displays the distribution (shape); the median (red line); and 1st and 3rd quartile (dotted black lines). (C) Representative dot plot of DNA content for Tbr2+ cells estimated by PI incorporation (horizontal axis) versus FSC relative cell size (vertical axis) for one E15.5 embryo. Cells in S-phase are highlighted. (D) Distribution of the proportion of Tbr2+ cells in S-phase at each developmental stage. Each dot represents one embryo. Violin representation of the data displays the distribution (shape); the median (red line); and 1st and 3rd quartile (dotted black lines). For each developmental stage, embryos were collected from at least 2 different litters. One-way ANOVA with Tuckey’s post hoc analysis was used for statistical analyses.
