Figure 5 .

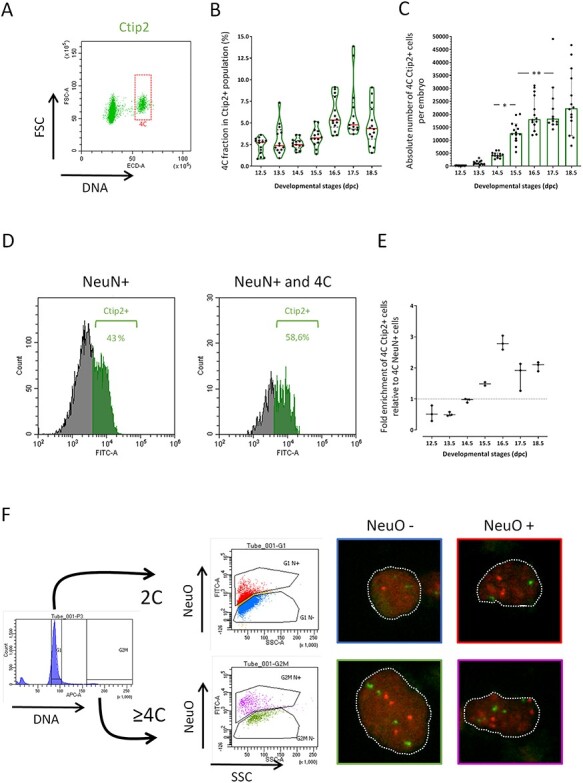
Identification of polyploid neurons in the developing neocortex. (A) Representative dot plot of DNA content for Ctip2+ cells estimated by PI incorporation (horizontal axis) versus FSC relative cell size (vertical axis) for one E15.5 embryo. Cells with a 4C DNA content are highlighted. (B) Distribution of the proportion of Ctip2+ cells with a 4C DNA content at each developmental stage. Each dot represents one embryo. Violin representation of the data displays the distribution (shape); the median (red line); and 1st and 3rd quartile (dotted black lines). (C) Absolute number of Ctip2+ cells with a 4C DNA content in the neocortex per embryo at each developmental stage. The histogram bars correspond to the mean with 95% CI error bars. Each dot represents the calculated value for one embryo. (D) Representative histogram plots for one E15.5 embryo highlighting Ctip2+ cells (green) within the NeuN+ fraction (left panel) and within the NeuN+ fraction with a 4C DNA content (right panel). (E) Ratio of NeuN+/4C/Ctip2+ fraction versus NeuN+/Ctip2+ fraction at each developmental stage. Each dot represents one embryo and error bars are for 95% CI. (F) Dissociated neocortical cells from E18.5 embryo were FACS-sorted based on DNA content and on labeling with NeuroFluor™ NeuO. Four distinct populations were collected based on the following parameters: 2C DNA content versus ≥4C DNA content; and NeuO negative cells (nonneurons) versus NeuO positive cells (neurons). Sorted cells were then processed for FISH using two DNA probes specific for the mouse chromosome 11 (red spots) and chromosome 2 (green spots). Dotted white lines highlight nuclei shape in representative images for each sorted populations. For each developmental stage, embryos were collected from at least 2 different litters. One-way ANOVA with Tuckey’s post hoc analysis was used for statistical analyses.
