
Figure 2 .
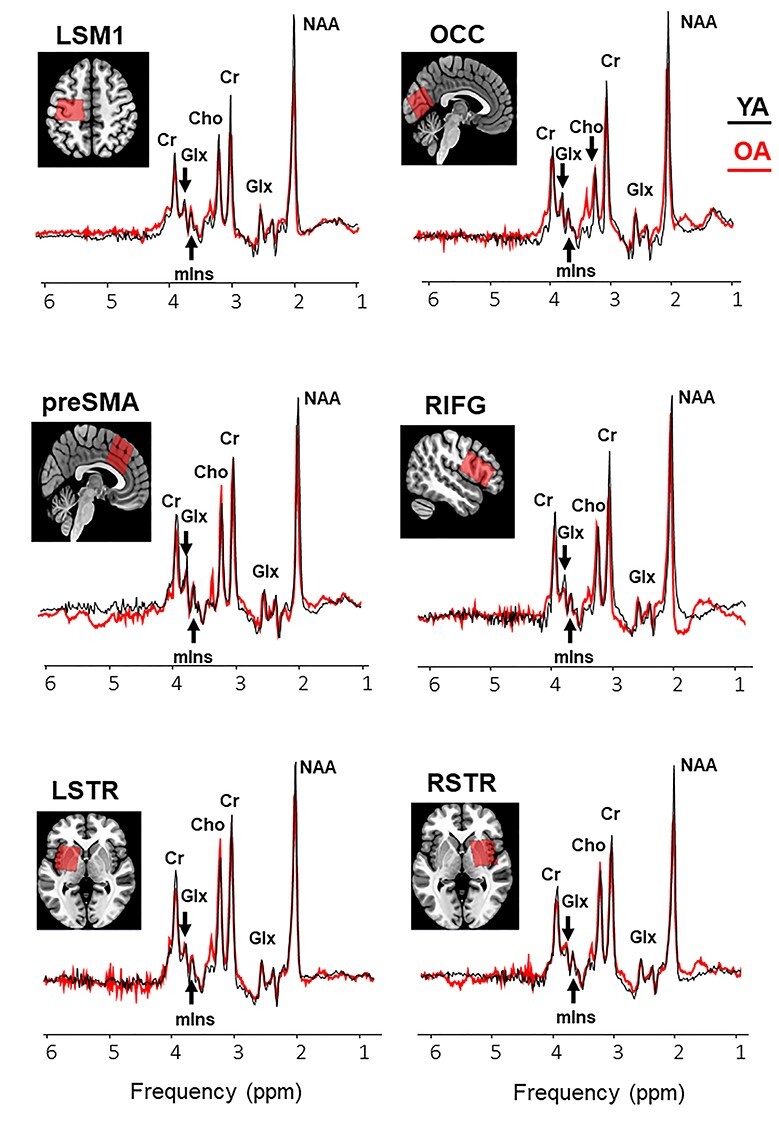
Example voxel positions (coregistered to T1) and group average spectra from young (black curve) and older (red curve) participants (right sensory motor cortex is not shown). Group means and variability measures of neurometabolite levels and tissue segmentation characteristics in the tested voxels are reported in Supplementary Table 1. Abbreviations: NAA, N-acetylaspartate; Glx, glutamate–glutamine complex; mIns, myo-inositol; Cho, choline; Cr, creatine + phosphocreatine; LSM1, left sensorimotor cortex; LSTR, left striatum; OCC, occipital cortex; preSMA, pre-supplementary motor area; RIFG, right inferior frontal gyrus; RSTR, right striatum.