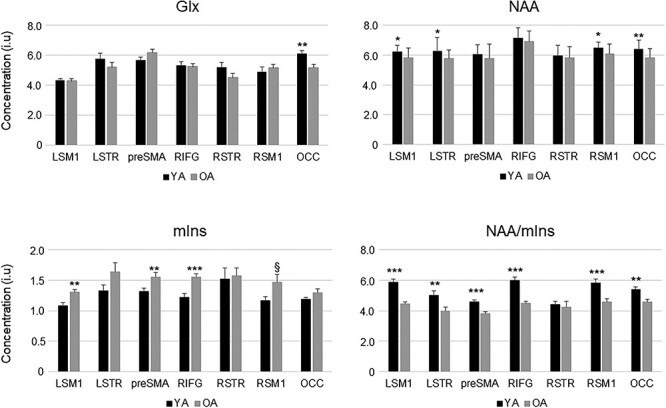
Figure 3 .

Tissue-corrected NAA, Glx, and mIns levels and NAA/mIns ratio in young adults (black bars) and older adults (gray bars). Bar plot shows mean values; error bars show standard error of mean (SEM). Abbreviations: NAA, N-acetylaspartate; Glx, glutamate–glutamine complex; mIns, myo-inositol; LSM1, left sensorimotor cortex; LSTR, left striatum; preSMA, pre-supplementary motor area; RIFG, right inferior frontal gyrus; RSTR, right striatum; RSM1, right sensorimotor cortex; OCC, occipital cortex. Significant group differences are indicated: P-levels: *P < P(FDR); **P < 0.01; ***P < 0.001; P(FDR) ≤ §P < 0.05. FDR = false discovery rate [P(FDR) = 0.021].
