
Figure 3 .
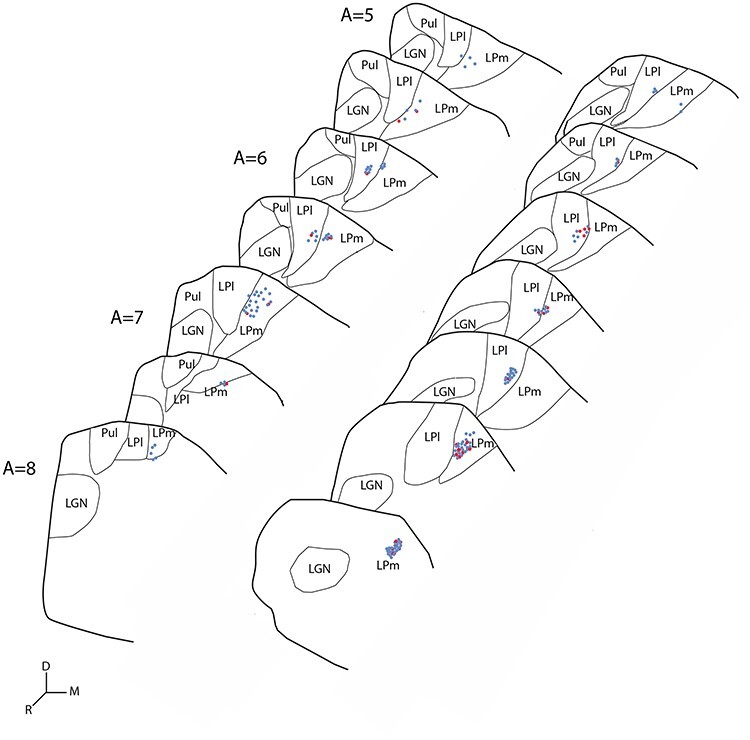
Schematic representation of the distribution of stereologically estimated BDA labeled terminals in coronal sections of the thalamus of 2 cases showing projections from area 21a to the LP in gray. Blue dots: type I axon terminals, Red dots: type II axon terminals, one dot represents 5 terminals, Scale 1 mm.