
Figure 7 .
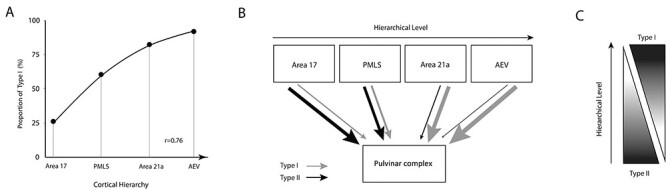
(A) Proportion in % of type I terminals as a function of the cortical hierarchy (data from the PMLS and the AEV were reconsidered from Huppe-Gourgues et al. 2019). (B) Schematic summary of CT circuitry involving the pulvinar where the thickness of gray and black arrows represents the proportion of type I and type II projections, respectively. (C) A general schematic of the changing proportion of type I and type II CT projections as a function of cortical hierarchy.