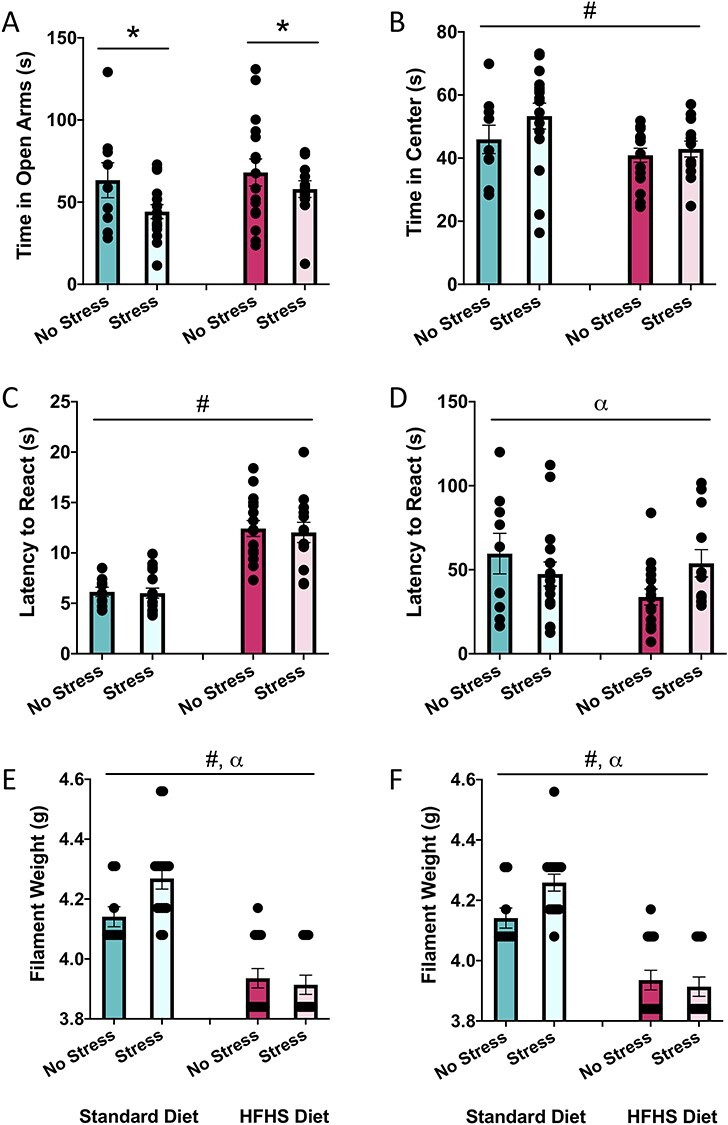
Figure 2 .

Graphical representation of behavioral results at the baseline timepoint. (A) Average time spent in the open arms of the EPM, (B) average time spent in the center of the EPM, (C) average latency to react to the hot plate, (D) average latency to react to the cold plate, (E) average filament weight to react to the von Frey on the left paw, and (F) average filament weight to react to the von Frey on the right paw. Means, along with individual data points,  standard error are depicted; * indicates a main effect of stress, # indicates a main effect of diet, and ⍺ indicates a significant diet × stress interaction, P < 0.05.
