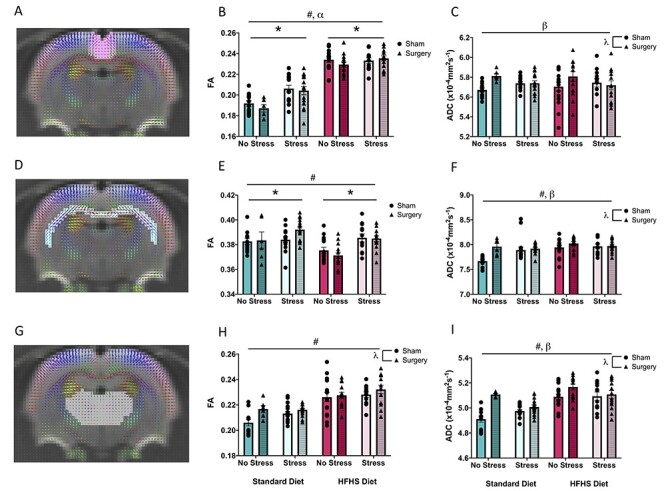
Figure 5 .

Graphical representation of diffusion tensor measures, FA and ADC from MRI analysis. (A) Visual representation of diffusion in the ACC, (B) average FA in the ACC, (C) average ADC in the ACC, (D) visual representation of diffusion in the CC, (E) average FA in the CC, (F) average ADC in the CC, (G) visual representation of diffusion in the thalamus, (H) average FA in the thalamus, and (I) Average ADC in the thalamus. Means, along with individual data points,  standard error are depicted; * indicates a main effect of stress, # indicates a main effect of diet,
  indicates a main effect of treatment, ⍺ indicates a significant diet × stress interaction, and
  indicates a significant stress × treatment interaction, P < 0.05.
