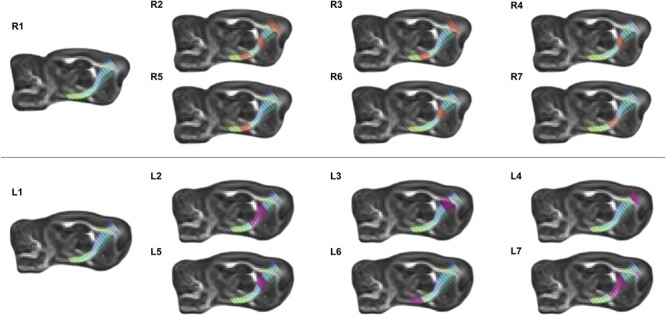
Figure 6 .

Illustrative representation of FA diffusion along the right (upper panel) and left (lower panel) corticospinal tract using advanced MRI tractography. R1, representative image of the R-CST. For R2–R7, regions of significance are highlighted in orange. R2, regions of the R-CST where FA diffusivity is positively correlated with consumption of the HFHS diet; R3, regions of the R-CST where FA diffusivity is positively correlated with MS; R4, regions of the R-CST where FA diffusivity is positively correlated with surgical treatment; R5, regions of R-CST where FA diffusivity is negatively correlated with thermal nociception on the hot plate; R6, regions of R-CST where FA diffusivity is negatively correlated with thermal nociception on the cold plate; and R7, regions of R-CST where FA diffusivity is negatively correlated with mechanical nociception in the right paw von Frey task. L1, representative image of the L-CST. For L2–L7, regions of significance are highlighted in magenta. L2, regions of the L-CST where FA diffusivity is positively correlated with consumption of the HFHS diet; L3, regions of the L-CST where FA diffusivity is negatively correlated with consumption of the HFHS diet; L4, regions of the L-CST where FA diffusivity is positively correlated with MS; L5, regions of L-CST where FA diffusivity is positively correlated with surgical treatment; L6, regions of L-CST where FA diffusivity is negatively correlated with mechanical nociception in the left paw von Frey task; and L7, regions of L-CST where FA diffusivity is negatively correlated with mechanical nociception in the right paw von Freytask.
