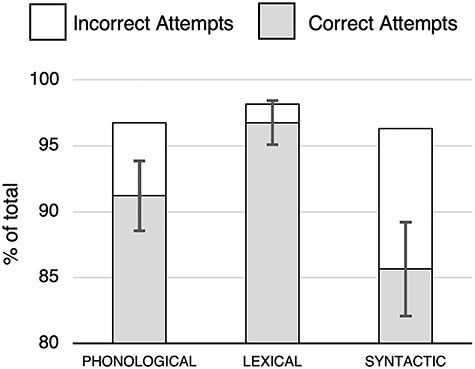
Figure 2 .

Behavioral data from the training phase. Data are shown as a percentage of the total possible number of utterances for each of the 3 levels of content (phonological, lexical, syntactic) during the perceive+rehearse task. Statistical analyses were performed on the proportion of accurate/attempted utterances. Error bars reflect standard error of the mean on the number of correctly attempted utterances. Note: in order to better display differences among conditions, the y-axis begins at 80% and not 0%.
