
Figure 1 .
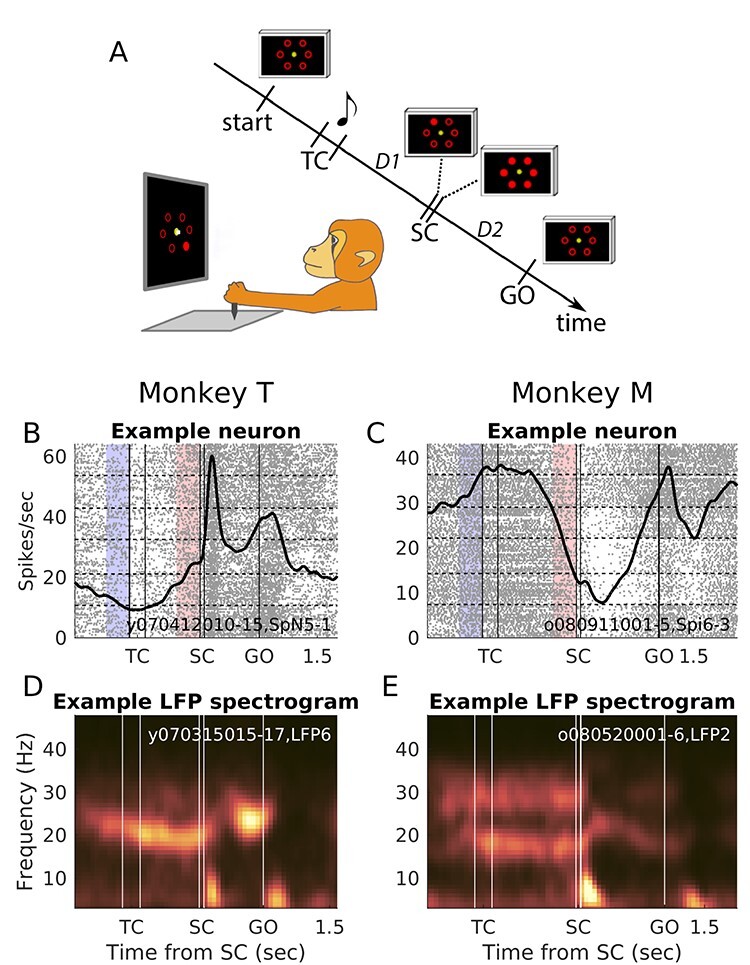
Behavioral paradigm and single neuron and LFP examples. (A) Behavioral paradigm. Left, drawing of the experimental apparatus showing the SC epoch (with the hand cursor on the central fixation dot). Right, sequence of task events, not to scale. Start indicates the moment when the monkey brings the hand cursor to the center of the screen to initiate a new trial. The musical note indicates the presentation of a tone. Tone pitch differs according to delay duration. All displays shown in the diagram stay on until the next one appears (hand cursor is not shown). TC, 200 ms; SC, 55 ms; D1, delay 1; D2, delay 2. Both delays have either short duration (700 ms in monkey T and 1000 ms in monkey M) or long duration (1500 ms in monkey T and 2000 ms in monkey M). There is also a 700 ms delay between start and TC. (B and C) Raster plots and peri-stimulus time histograms (PSTHs) of 2 example neurons, in short delay trials, 1 for each monkey (session and neuron ID indicated inside plots). In the raster plot, each dot is an action potential and each row a trial, ordered vertically according to the 6 target/movement directions. The thick black line represents the neuronal activity averaged across all the shown trials (PSTH; smoothed with a Gaussian filter of length 100 ms and sigma 50 ms). The thin vertical lines mark each task event (TC on/off, SC on/off and GO). The horizontal dashed lines separate the different movement directions (clockwise shift of direction starting with movement toward 3 o’ clock from the bottom to the top of the raster displays). The epochs marked in light red preceding SC and light blue preceding TC were used for the trial-by-trial correlation analyses. (D and E) Spectrograms of 1 representative example LFP for each monkey, including all correct short delay trials (session and LFP number indicated inside plots). Frequency is on the vertical axis and time along the horizontal axis. Warmer colors indicate increased power (a.u.) using a perceptually flat color-map (Crameri 2018), with color limits set to the minimum and maximum power values above 10 Hz, separately for each monkey. To create the spectrograms, the LFPs were first high-pass filtered at 2 Hz with a fourth order Butterworth filter before the power spectral density (based on discrete Fourier transform) was calculated, at 1 Hz frequency resolution. The averages across all trials were plotted at the center of each sliding window (300 ms duration, 50 ms shifts). The brief power-increases below 10 Hz after SC and GO reflect visual and movement evoked potentials.