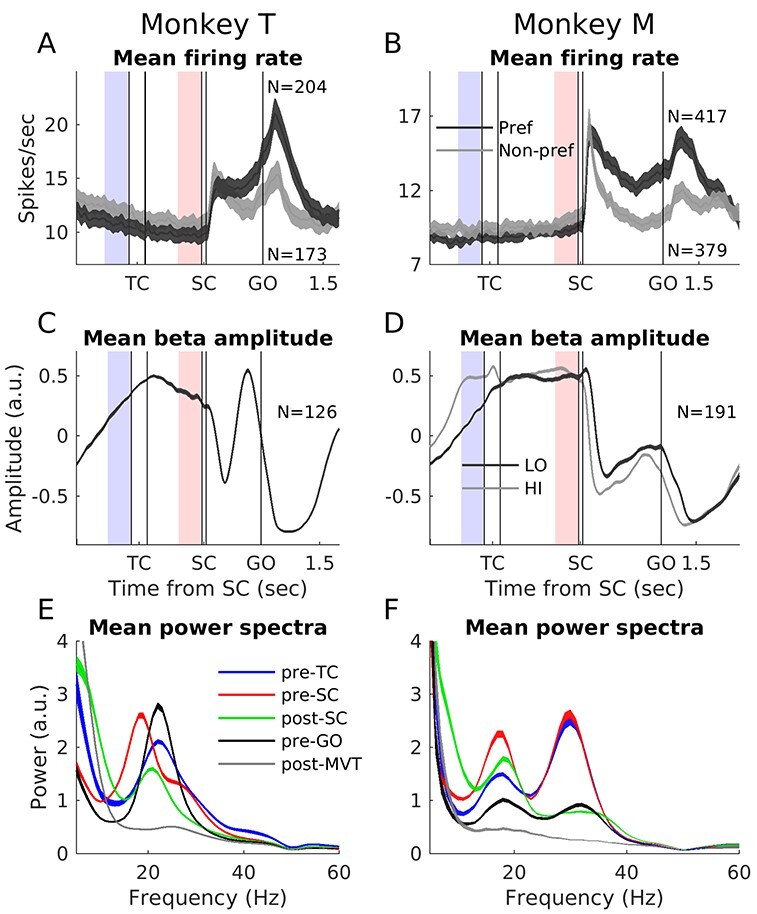
Figure 2 .

Mean neuronal firing rate, LFP beta amplitude and power spectra. (A and B) Mean firing rate for all neurons included in the task-related correlation analysis, for preferred (dark gray) and nonpreferred (light gray) movement directions, in short delay trials for monkey T (left) and monkey M (right). The curves reflect the mean firing rate ± standard error of the mean (SEM) across neurons. The mean rate for each SUA was smoothed with a Gaussian filter of length 50 ms and sigma 20 ms, before averaging. N indicates the number of included neurons. N is smaller in the nonpreferred direction due to the 3 Hz inclusion criterion (see Materials and Methods). This inclusion criterion also causes a slightly higher population firing rate prior to SC for the nonpreferred direction. Per definition the rate is lower after SC for the nonpreferred compared with the preferred direction, and the somewhat fewer neurons for the nonpreferred direction have on average slightly higher rate from the start of the trial. Data between trial start and until 1000 ms after the GO signal (as depicted) were included in the task-related correlation analysis. The epochs marked in light red preceding SC and light blue preceding TC were used for the trial-by-trial correlation analysis. (C and D) Average LFP beta amplitude for all LFPs. LFPs that were part of multiple beta-neuron pairs were included only once (N shown for each monkey). The curves reflect the mean amplitude ± SEM across LFPs. LFP beta amplitude was estimated from the analytical signal (Hilbert transform), as described in the methods. Before averaging across LFPs we normalized the beta amplitude of each LFP by subtracting the mean and dividing by the standard deviation. The epochs in light red preceding SC and light blue preceding TC were used for the trial-by-trial correlation analysis and their power spectra are shown in the red and blue curves in (E and F), respectively. (E and F) Average LFP power spectra in 5 different 300 ms duration trial epochs, either aligned to external task events (pre-TC, pre-SC, post-SC, and pre-GO) or to movement initiation (post-MVT). The curves reflect the mean power ±SEM across LFPs, for the same LFPs that are included in (C) and (D). Before spectral analysis, each LFP was treated offline with a narrow 50-Hz “notch” filter (eighth order Butterworth band-stop filter with stop band 49–51 Hz). The power spectral density (based on discrete Fourier transform at 1 Hz frequency resolution) for each LFP was normalized to the mean power across all epochs between 10 and 40 Hz before averaging across LFPs.
