Figure 3 .

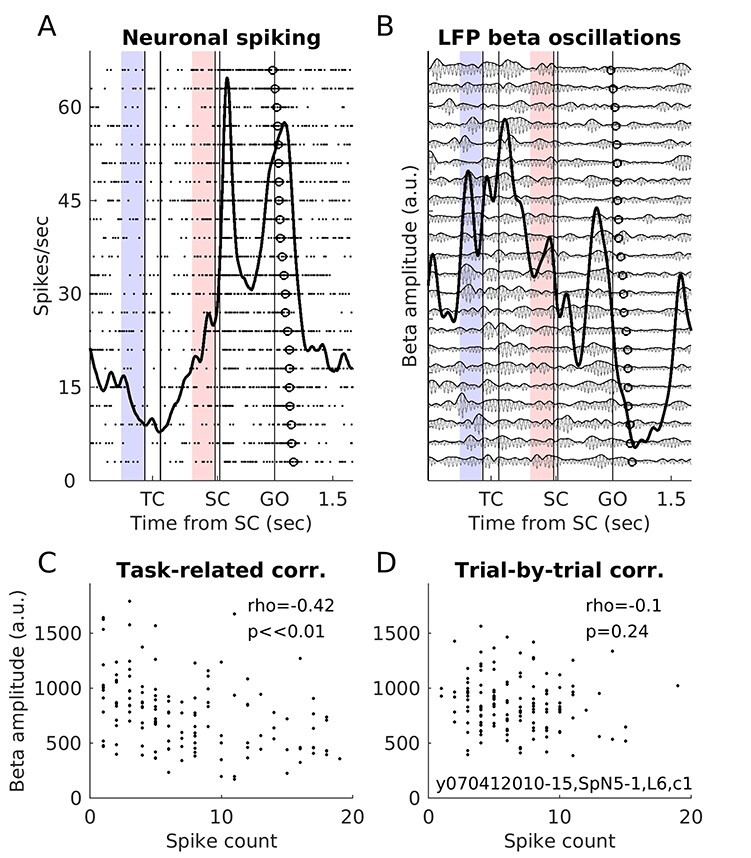
Example beta-neuron pair. (A) Raster plot and PSTH of 1 example neuron in its preferred movement direction, in short delay trials (from monkey T; session, neuron and LFP ID, and condition indicated inside plot D; same neuron as in Fig. 1B). In the raster plot, each dot is an action potential and each row a trial, ordered vertically according to reaction times (open circles; shortest on top). The thick black line represents the neuronal activity averaged across all the shown trials (PSTH; smoothed with a Gaussian filter of length 100 ms and sigma 50 ms). The epoch marked in light red preceding SC (also in B) was used for the pre-SC trial-by-trial correlation analysis shown in D (that also included the short delay trials for all the other movement directions). The light blue epoch preceding TC (also in B) was used for the pre-TC trial-by-trial correlation analysis (not shown). (B) LFP from another co-recorded electrode, filtered for the beta range (22 ± 5 Hz; light gray curves), for the same trials as for the neuron in A. Darker gray curves show the instantaneous beta oscillation amplitude, which was estimated from the analytical filtered LFP as the Hilbert transform signal envelope. The thick black line indicates the average beta amplitude across all shown trials (smoothed with a Gaussian filter of length 100 ms and sigma 50 ms). (C) This pair’s task-related correlation, for short delay trials in the preferred direction. Each dot corresponds to one 300 ms window, with combined single values of mean beta amplitude and spike count (N = 135). The Spearman’s rho was −0.42, a highly significant negative correlation. (D) This pair’s trial-by-trial correlation in the pre-SC epoch, for short delay trials (N = 135). Each dot corresponds to the mean beta amplitude and spike count for 1 trial, in the 300 ms pre-SC window marked in light red in (A) and (B). The correlation was not significant. The pre-TC trial-by-trial correlation in this pair was also not significant (not shown).
