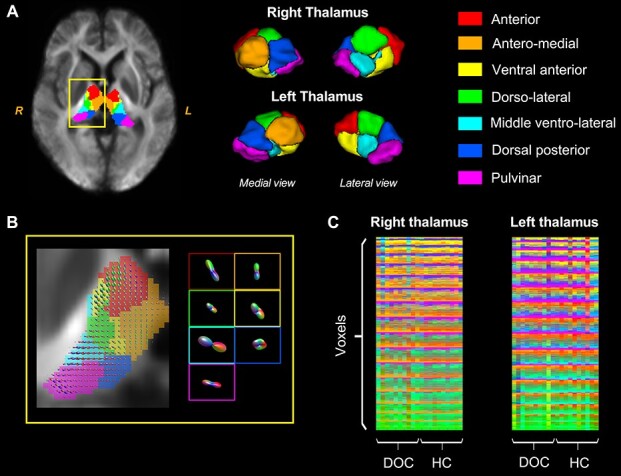
Figure 2 .

Visualization of the segmentation results. (A) Thalamic nuclei identified based on the FOD population template, as an example (segmentation on individual brains was not shown). (B) Thalamic FOD in the yellow rectangle in (A) and the average FOD of the 7 nuclei. (C) The concatenation of all thalamic voxels across individuals showed that the segmentation results were highly consistent across subjects. The color matrices illustrate the nuclei identity (1–7) of each voxel in the left or right thalamus for each of the subjects in the HC or DOC groups. Colors indicate different thalamic nuclei as shown in (A).
