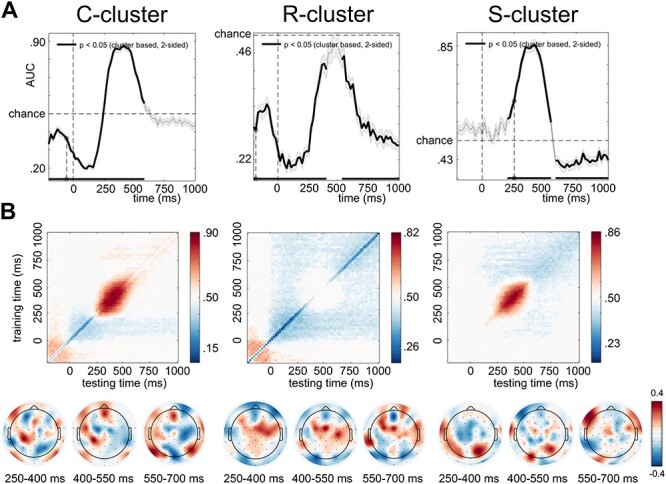
Figure 4 .

Decoding accuracy and temporal generalization matrix for the C-, R-, and S-cluster data. (A) Decoding accuracy for the 3 RIDE clusters. Significant time windows (P < 0.05, after cluster-based permutation) are indicated by thicker lines. (B) Temporal generalization matrices and maps of forward transformation weights of the decomposed EEG data. Significant samples are indicated by saturated colors. Unsaturated colors represent P-values below the multiple-comparison corrected threshold.
