
Figure 4 .
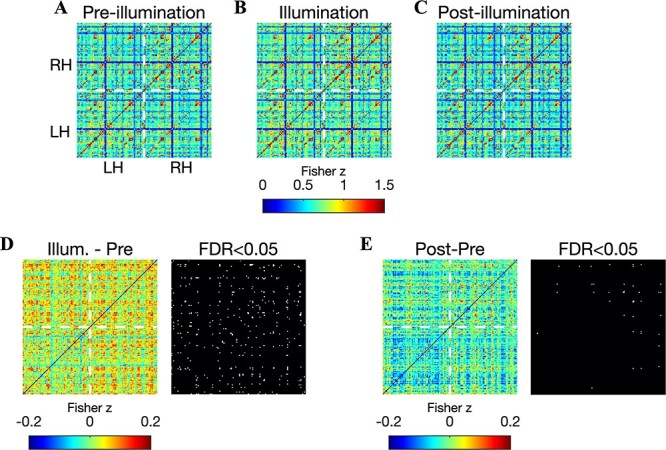
Brain-wide increases in FC during illumination (echo 3). Images show the correlation matrix between all pairs of 151 ROI time courses before (A), during (B), and after (C) illumination. The lower left and upper right quadrants indicate connections within the left and right hemispheres, respectively. The upper left and lower right quadrants indicate interhemispheric connectivity. Stimulation was delivered to the right frontal pole. (D) The difference between correlation matrices measured during and before illumination: a broad increase of up to 0.2 was readily observed, with a visible dampening of the increase in the lower left quadrant—left hemispheric connections were less affected. Binary image (right) indicates the connections that exhibited a significant increase (in white) during illumination (permutation test, corrected for 11 325 comparisons using the FDR at 0.05). A total of 283 significant connections were detected. (E) Same as (D) but now between the postillumination and preillumination periods. A total of 32 connections exhibited a statistically significant increase after illumination, with a majority of these located within the right hemisphere.