
Figure 5 .
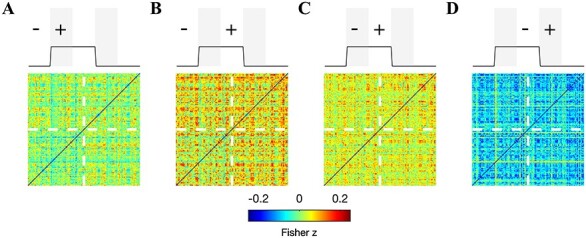
Accumulation of brain-wide FC throughout the illumination period. Images depict FC difference matrices between: (A) the first 5 min of illumination and the 5-min preillumination window, (B) the second 5 min of illumination and the 5-min preillumination window, (C) the second 5 min of illumination and the first 5 min of illumination, and (D) the first 5 min after illumination and the second 5 min of illumination. All matrices are shown for echo 3. Notice that, at many connections, FC is continuing to increase during the latter half of illumination.