
Figure 7 .
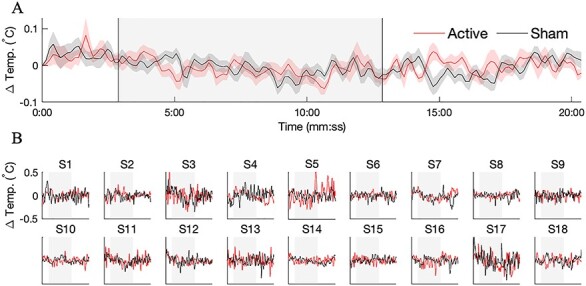
No evidence for brain heating with MR thermometry. A separate cohort of n = 20 subjects was recruited for a study aimed at resolving temperature changes during tPBM with the same dose as the BOLD study. (A) Group-averaged temperature in the illuminated region, shown separately for active (red) and sham (black) stimulation. Error bars depict the SEM across n = 20 subjects. We failed to detect any time points during which the temperature in the illuminated region was significantly different during active versus sham stimulation (paired Wilcoxon signed-rank test, n = 20, corrected for multiple comparisons by controlling the FDR at 0.05) (B) Temperature time courses for individual subjects. In all, 2 of the 20 subjects were excluded due to excessive recording artifacts. Despite the presence of drifts and spurious fluctuations, the temperature time series of active and sham stimulation largely overlapped.