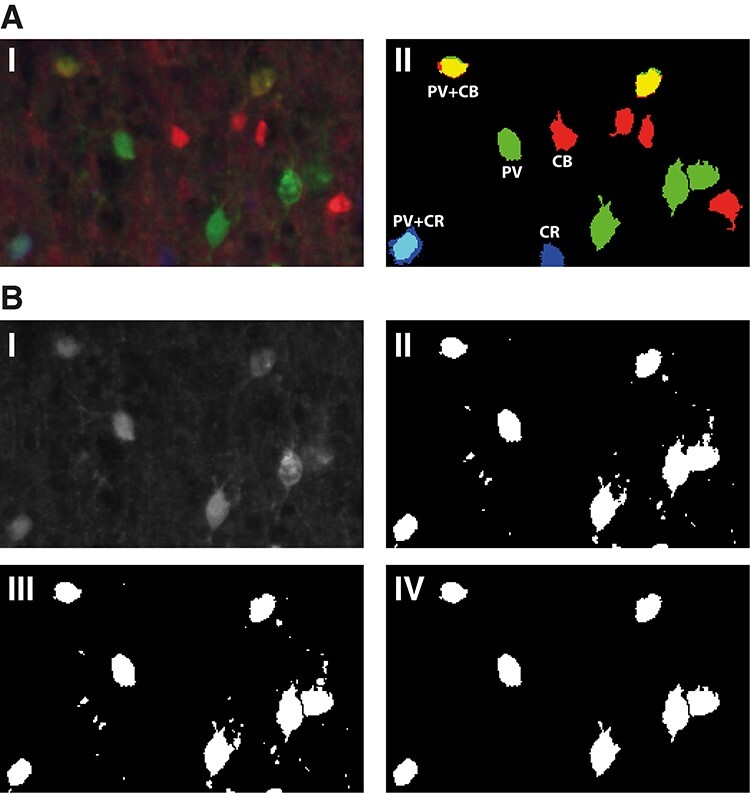
Figure 2 .

Image processing steps. A. I. Detail of layer II/III from a fluorescent 3-channel image of a macaque V1 20μm thick section, stained for PV (green), CB (red), and CR (blue). Note the presence of double-stained cell bodies (cyan:PV + CR, yellow:PV + CB). II. Thresholded 3-channel image with the cell bodies included in the quantification. B. Objective thresholding steps for every image channel, illustrated for the green (PV) channel of image A. I. Raw signal; II. Thresholded image with optimal threshold; III. Segmentation of adjoining cell bodies using watershed (see Methods). IV. Cell bodies included in the analysis after thresholding for size (100–500 pixels) and circularity (0.5 to 1).
