
Figure 4 .
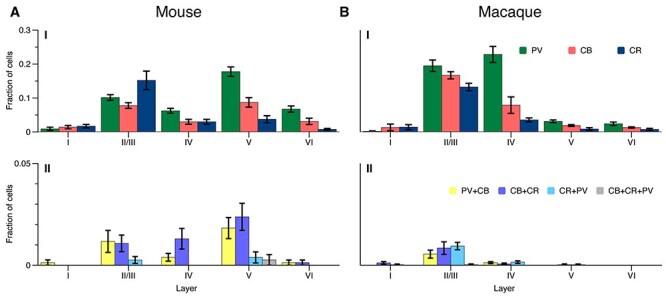
Average CBP-IR cell counts per layer in mouse (A) and macaque (B), normalized to the overall cell count. Bars represent standard error of the mean across sections. PV:green, CB:red, CR:blue, CB + CR:purple, CB + PV:yellow, CR + PV:cyan, CB + CR + PV:gray.