
Figure 5 .
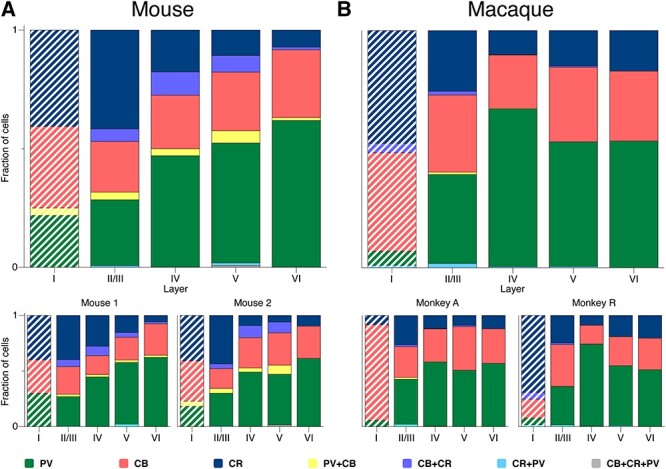
CBP-IR fraction within the cortical layers of mouse (A) and macaque (B) V1. PV:green, CB:red, CR:blue, CB + CR:purple, CB + PV:yellow, CR + PV:cyan, CB + CR + PV:gray. Hatched bars: data for layer 1 was variable across sections.
Official websites use .gov
A
.gov website belongs to an official
government organization in the United States.
Secure .gov websites use HTTPS
A lock (
) or https:// means you've safely
connected to the .gov website. Share sensitive
information only on official, secure websites.
CBP-IR fraction within the cortical layers of mouse (A) and macaque (B) V1. PV:green, CB:red, CR:blue, CB + CR:purple, CB + PV:yellow, CR + PV:cyan, CB + CR + PV:gray. Hatched bars: data for layer 1 was variable across sections.