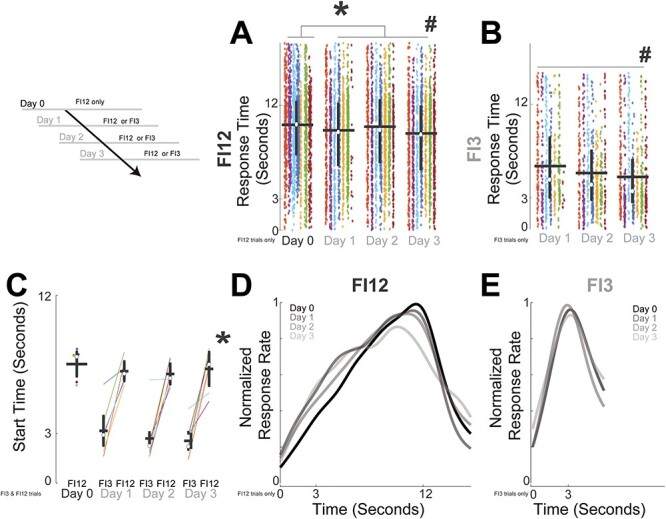
Figure 2 .

Response times reflect temporal context. Rats trained to respond at one 12-s interval on Day 0 were then trained on Days 1–3 in a new temporal context with two intervals: 12 s (FI12) and 3 s (FI3). (A) Plot of all responses from all animals for FI12 trials only on Day 0 and Days 1–3; each animal is plotted in a different color. * indicates a main effect of context (one vs. two intervals, or Day 0 vs. Days 1–3), # indicates a main effect of day (over Days 1–3) via GLMMs. White dots denote the median, horizontal lines denote the mean and vertical lines span the interquartile range. (B) Plot of all responses from all animals for FI3 trials only on Days 1–3, # indicates a main effect of day via GLMMs. (C) Plot of start times calculated from single-trial analysis for each animal on Days 0–3 for FI3 and FI12 trials; * indicates a main effect of interval via GLMMs. Normalized time-response histograms for (D) FI12 trials and for (E) FI3 trials from Day 0 (black) and Days 0–3 (shades of gray). Kernel-density histograms for plotting only calculated at 0.1 s bins with a bandwidth of 1 then averaged and normalized across 7 animals. Data from 4799 FI12 responses and 1744 FI3 responses in 7 animals.
