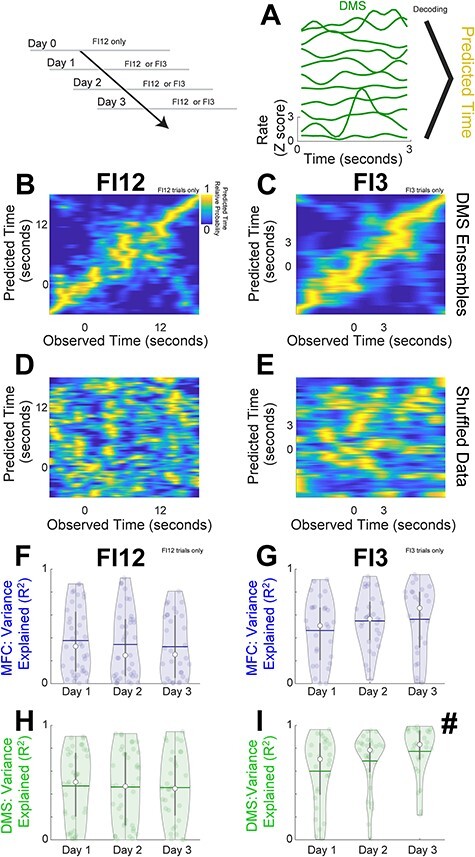
Figure 5 .

DMS improves temporal decoding with subsequent two-interval performance. (A) We trained decoders (naïve Bayesian classifiers) to predict time from firing rate on a trial-by-trial basis. (B) Decoder performance for DMS ensembles for FI12 trials and (C) for FI3 trials. Predicted time is on the y-axis and observed time is on the x-axis with the relative probability represented in color and yellow representing the highest relative probability. Decoded performance for the same DMS ensembles with time-shuffled data for (D) FI12 trials and (E) FI3 trials. We measured decoder performance by calculating the variance explained (R2) of predicted versus observed time. R2 values plotted for Days 1–3 for MFC on (F) FI12 trials and for (G) FI3 trials, and for the DMS for (H) FI12 trials and for (I) FI3 trials. For FI3 trials, R2 of DMS ensembles increased with subsequent days of two-interval performance. Each circle represents a single decoded trial for each ensemble; white dots denote the median, horizontal lines denote the mean, and vertical lines span the interquartile range. # indicates a main effect of day in GLMMs. Data from the same 350 MFC and DMS neurons across Days 1–3 in 7 animals as in Fig. 4.
