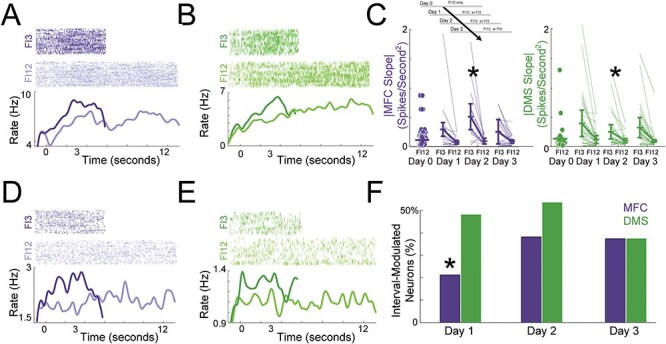
Figure 6 .

MFC and DMS activity is distinct on FI3 versus FI12 trials. (A) An exemplar ramping neuron from the MFC and (B) from the DMS; the slope of firing rate versus time was steeper on FI3 versus FI12 trials. (C) |slopes| for MFC (blue) and DMS (green) neurons on Day 0, Day 1, Day 2, and Day 3 for FI3 and FI12 trials; for both MFC and DMS, observed |slopes| were higher on FI3 trials; horizontal lines are means and vertical lines are interquartile ranges. * indicates main effect of interval via two-way ANOVA (day and interval) of GLMMs. (D) An exemplar neuron from the MFC and (E) from the DMS that fired differentially on FI3 versus FI12 trials. (F) The number of neurons with a main effect of firing rate versus interval for the MFC and DMS; * indicates P < 0.05 via a Chi-squared test. Data from the same 350 MFC and DMS neurons across Days 1–3 in 7 animals as in Fig. 4 on FI12 and FI3 trials.
