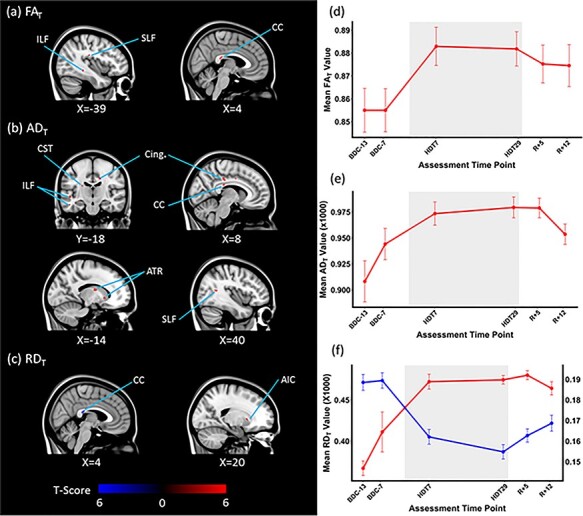
Figure 6 .

HDBR + CO2 effects on white matter diffusivity. White matter structures showing significant acute changes in (a) FAT, (b) ADT, and (c) RDT values as a function of HDBR + CO2 are depicted. Areas showing positive changes are marked in red and negative changes are marked in blue (P = 0.05, FWE corrected). The average (d) FAT, (e) ADT, and (f) RDT values of each assessment time point of the peak voxel of the largest cluster showing acute changes with HDBR + CO2 are shown. (a) The acute increase in FAT value of the splenium of the corpus callosum (MNI 4, −32, 17) and (b) the acute increase in ADT values of the Body of corpus callosum (MNI 16, −18, 36). (f) The acute increase in RDT value of the right anterior limb of internal capsule (MNI 20, 14, 1) in red and the acute decrease in RDT value of the body of corpus callosum (MNI 3, −30, −18) in blue. The axis of the acute negative change is shown on the right side. The bed rest phase is demarcated in gray. The error bars indicate SEM. ILF: Inferior longitudinal fasciculus, SLF: Superior longitudinal fasciculus, CC: Corpus callosum, CST: Corticospinal tract, Cing.: Cingulate, ATR: Anterior thalamic radiation, AIC: anterior limb of the internal capsule.
