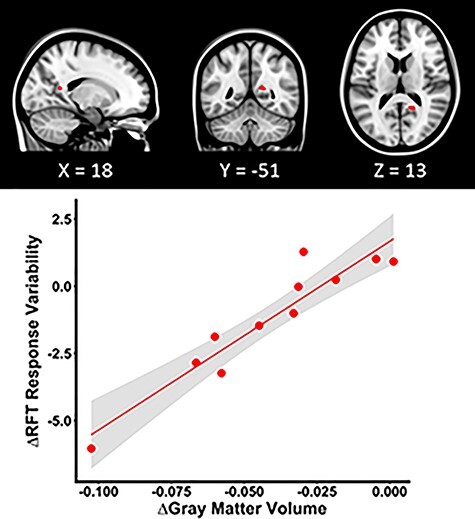
Figure 2 .

GM structure and function correlation within the HDRB + CO2 group. HDRB + CO2 individuals who showed more variable RFT response patterns at HDT29 than at BDC-7 exhibited less reduction in the precuneus cortex volume, marked in red, at HDT29 than at BDC-7. The scatter plot depicts the pre-to-post bed rest mean change in GM volume of the peak voxel as a function of the pre-to-post bed rest change in RFT response variability. The shaded area indicates the 95% confidence interval.
