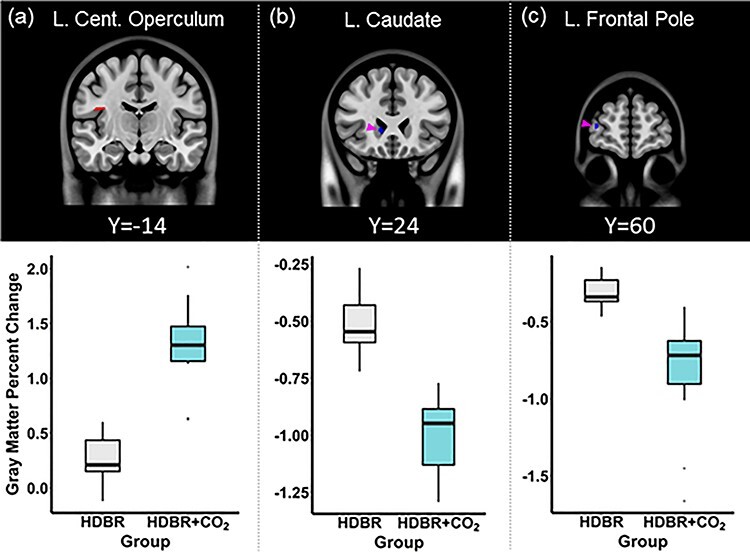
Figure 3 .

HDBR versus HDBR + CO2 structural brain change. The top panel depicts the brain areas in which significant (P = 0.05, FWE corrected) group differences in the degree of GM volume change were observed. The HDBR + CO2 group showed greater GM volume increase in (a) the left central operculum cortex and greater decrease in (b) the left caudate (highlighted by the pink arrow) and (c) left frontal pole (highlighted by the pink arrow), in comparison to the HDBR group. The bottom panel illustrates the average degree of GM volume change within the peak voxel of the clusters shown above, in the HDBR and HDBR + CO2 groups. L: Left, Cent: Central.
