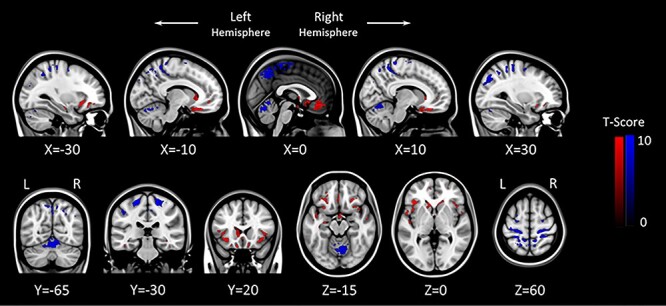
Figure 4 .

FW flexible factorial model analysis results (P = 0.05, FWE corrected). Areas showing acute FW increase with HDBR + CO2 are marked in red. Inversely, brain regions showing acute FW decrease with HDBR + CO2 are marked in blue. The left side of the coronal and sagittal images (bottom row) corresponds to the left hemisphere of the brain. L: Left, R: Right.
