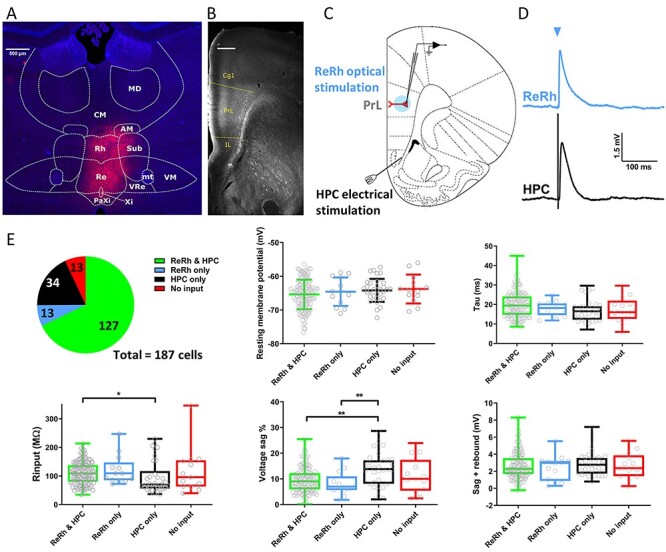
Figure 1 .

Electrophysiological characterization of L5 pyramidal cells receiving optogenetically activated nucleus reuniens/rhomboid synapses. (A) Representative widefield-fluorescence image showing neuronal transduction of nucleus reuniens (Re) and rhomboid nucleus (Rh) following injection of AAV9:CaMKii:hChR2 (E123T/T159C):mCherry (red) and DAPI (blue). VRe, ventral reuniens; Xi, xiphoid; PaXi, paraxiphoid; CM, central medial; AM, anteromedial; VM, ventromedial; MD, mediodorsal; Sub, submedius thalamic nuclei; mt, mammillothalamic tract. (B) Monochrome image of mCherry positive fibers in PFC following AAV injection into ReRh. Dotted lines denote the boundaries of prelimbic cortex. mCherry signal is amplified with anti-mCherry antibody. Cg1, cingulate cortex; IL, infralimbic cortex; PrL, prelimbic cortex. Scale bar = 500 μm. (C) Schematic of acute mPFC slice with whole-cell recording from layer 5 pyramidal neuron in PrL, light activation of soma and proximal dendrites via microscope objective (blue) and stimulation of hippocampal fiber bundle using conventional stimulating electrode. (D) Representative ReRh (blue) and HPC (black) EPSPs. Blue arrow denotes light activation. (E) Proportion of cells receiving different permutations of ReRh and HPC inputs, 187 cells from 65 animals. Passive membrane properties measured from −100 pA current injection split by synaptic input. RMP plotted as mean ± standard deviation, one-way ANOVA F(3,183) = 1.2, P = 0.32. Other parameters one or more column failed Shapiro–Wilk test for normality, box plots show median and interquartile range, whiskers max and min data points. Kruskal–Wallis test P values: Tau = 0.074, Rinput = 0.031, Sag % = 0.0036, sag + rebound = 0.84. */** = P < 0.05/0.01 Dunn’s multiple comparisons post-hoc.
