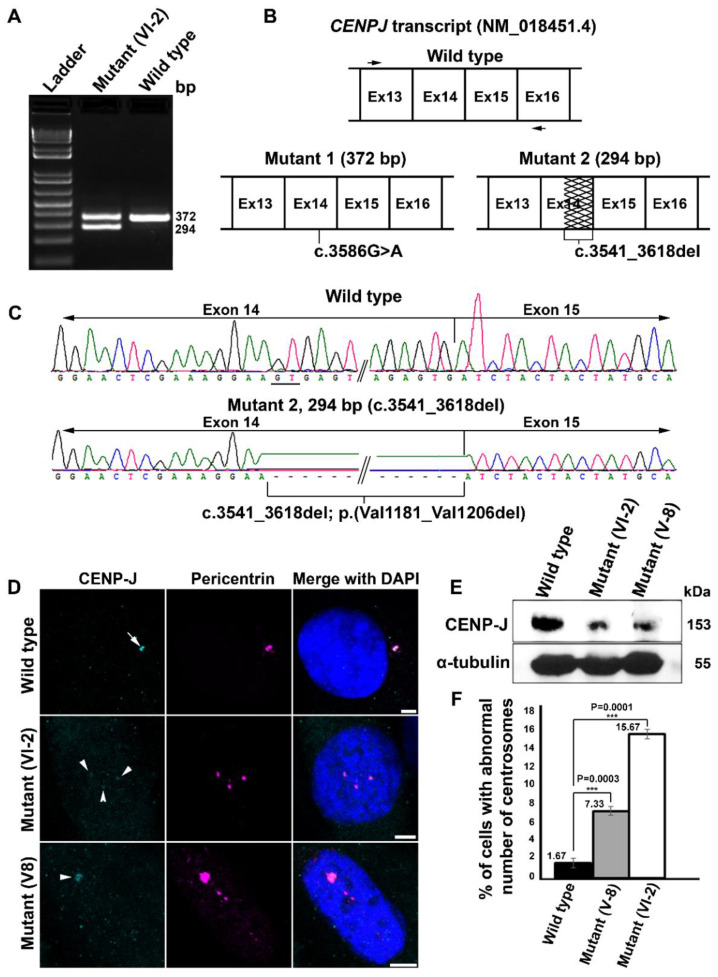
Figure 3.
Investigation of CENPJ transcript and protein in family 4. (A) Electropherogram (2% agarose) of amplicons covering portion of CENPJ obtained from cDNA of patient VI-2 of family 4 along with the wild type. (B) Schematic of partial region of CENPJ wild-type transcript (top) showing the locations of the primers (black arrows) used to amplify the cDNA. Lower left panel shows the schematic of CENPJ transcript with a size comparable to that of the wild type and carrying the missense mutation. Lower right panel indicates the schematic of the mis-spliced transcript, with a 78-bp deletion (shown by zigzag lines) in exon 14. (C) Sanger traces of the amplicons obtained from mutant and wild-type cDNA. The top panel shows traces of the wild type and the lower panel belongs to the smaller, mis-spliced mutant, showing deletion of 78 bp. The position of the cryptic splice donor site (GT) is underlined in wild-type traces. (D) Confocal microscopy images of the primary fibroblasts derived from different patients (V-8 and VI-2) of family 4. Localization of CENP-J is indicated by white arrows (wild type) and arrowheads (mutants). Reduced immunoreactivity is evident in both mutants as compared to the wild type. Scale bar 5 µm. (E) Immunoblotting showing the relative quantity of CENP-J (upper panel) in wild-type and patient-derived primary fibroblasts. The internal control α-tubulin is shown in the lower panel. (F) Percentage cells with supernumerary centrosomes in wild-type and patient-derived primary fibroblasts of family 4. Exact data points are shown on the top left side of the respective bar. Error bars depict the standard deviation (SD). The p values are 0.0003 for mutant V-8 and 0.0001 for mutant VI-2 (Student’s t test); three experiments were considered where 100 cells were accounted for each experiment.

