
Figure 10 .
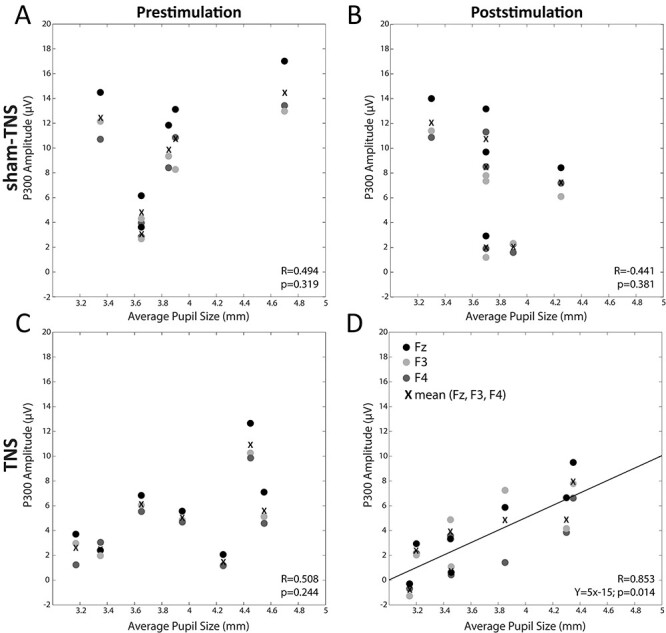
Regression analysis between the P300 amplitude in frontal electrodes and the average pupil size observed before (A,C) and after (B,D) sham-TNS (A,B) and TNS (C,D) condition. The regression lines have calculated for the average values of the 3 frontal electrodes represented in the plot, which are indicated by crosses.